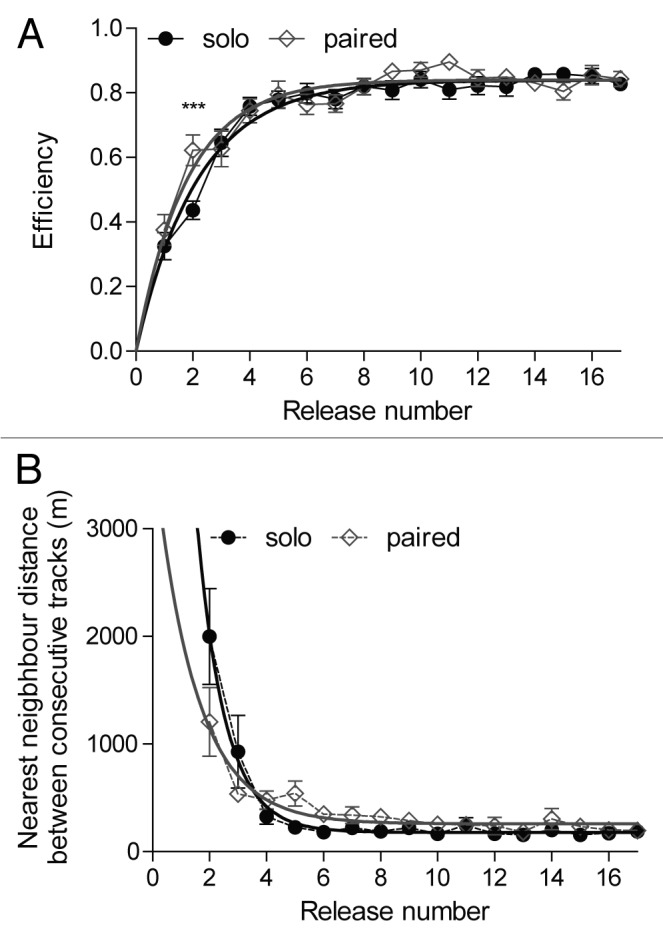
Figure 2. Training data from homing pigeons released 17 times consecutively from the same release site, either singly or in pairs. (A) Homing efficiency (mean ± S.E.M.) and (B) nearest neighbor distance (mean ± S.E.M.) between consecutive tracks as a function of training progression. Black circles indicate group averages for solo training; white diamonds correspond to paired training. Solid lines show nonlinear regression curves fitted to the data (see main text). Asterisks represent significant differences (Bonferroni post hoc test, P < 0.001).
