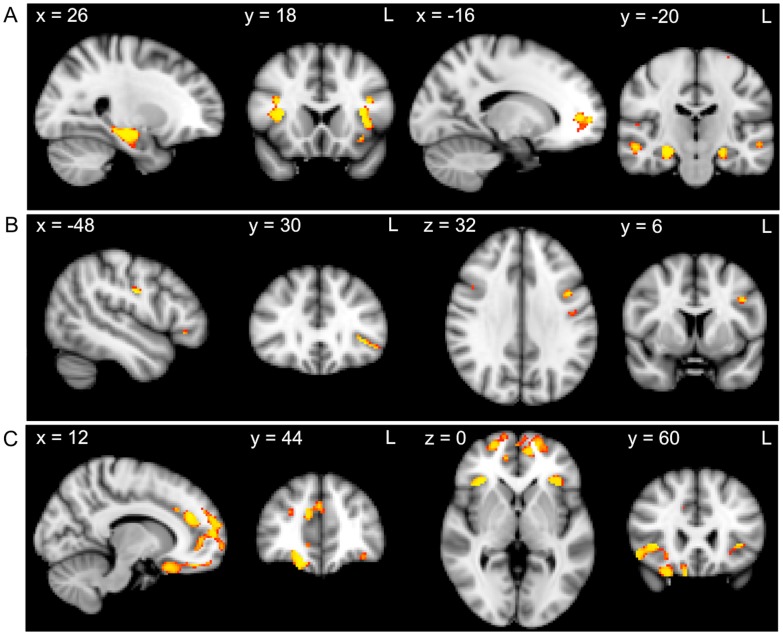
Figure 1. Grey matter atrophy correlates for recall, DLPFC task and VMPFC task performance across all participants.
VBM analysis showing brain regions in which grey matter intensity correlates with the A) recall composite, B) DLPFC task composite and C) VMPFC task composite. Clusters are overlaid on the MNI standard brain. Coloured voxels show regions that were significant in the analysis for p<.05, corrected for multiple comparisons via Family-wise Error correction across space, and a cluster threshold of 50 contiguous voxels.

