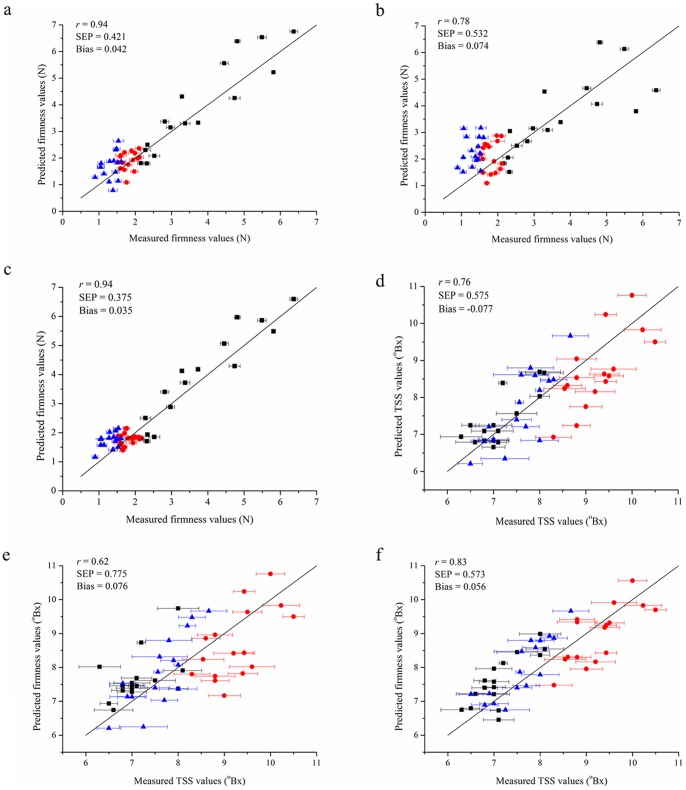
Figure 3. Comparison of predicted and measured values for the prediction sets.
(a) prediction of firmness using PLS model; (b) prediction of firmness using SVM model; (c) prediction of firmness using BPNN model; (d) prediction of TSS using PLS model; (e) prediction of TSS using SVM model; (f) prediction of TSS using BPNN model. The black square indicated the unripe strawberry fruit; the red circle indicated the ripe strawberry fruit; the blue triangle indicated the overripe strawberry fruit.

