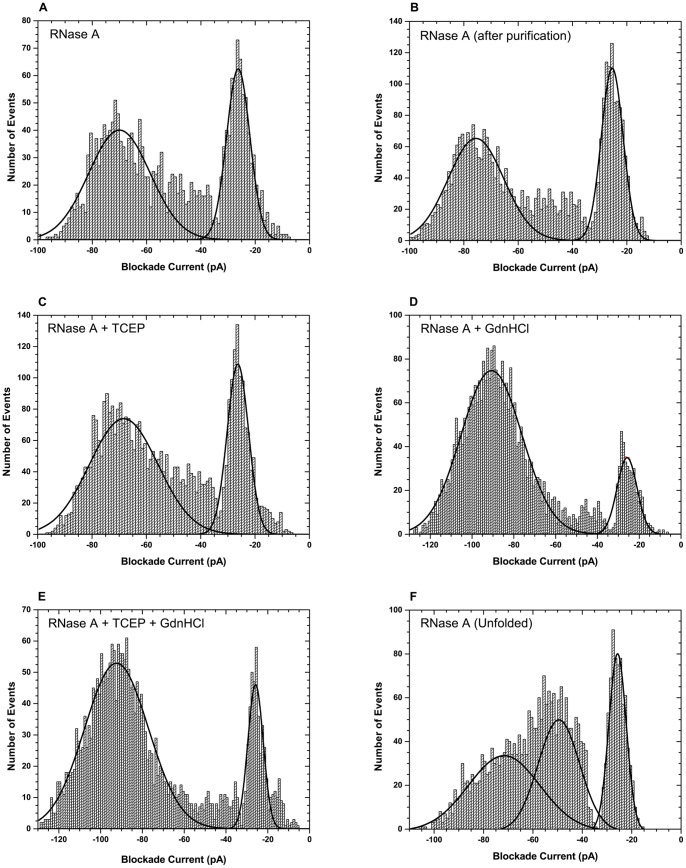
Figure 3. Nanopore analysis of RNase A under different experimental conditions.
Blockade current histograms obtained for (A) natively folded RNase A, (B) natively folded RNase A after being subjected to size exclusion and ion exchange chromatography, (C) reduced RNase A, (D) RNase A in presence of 1 M GdnHCl, (E) reduced RNase A in presence of 1 M GdnHCl, and (F) completely unfolded RNase A. For the analysis of completely unfolded RNase A, the protein was pre-incubated in 4 M GdnHCl and 100 mM TCEP prior to adding it to the cis chamber. Each event population is fitted with the Gaussian function to obtain the peak/population blockade current value. The peak blockade current values are presented in Table 2. All analysis were performed at 100 mV.

