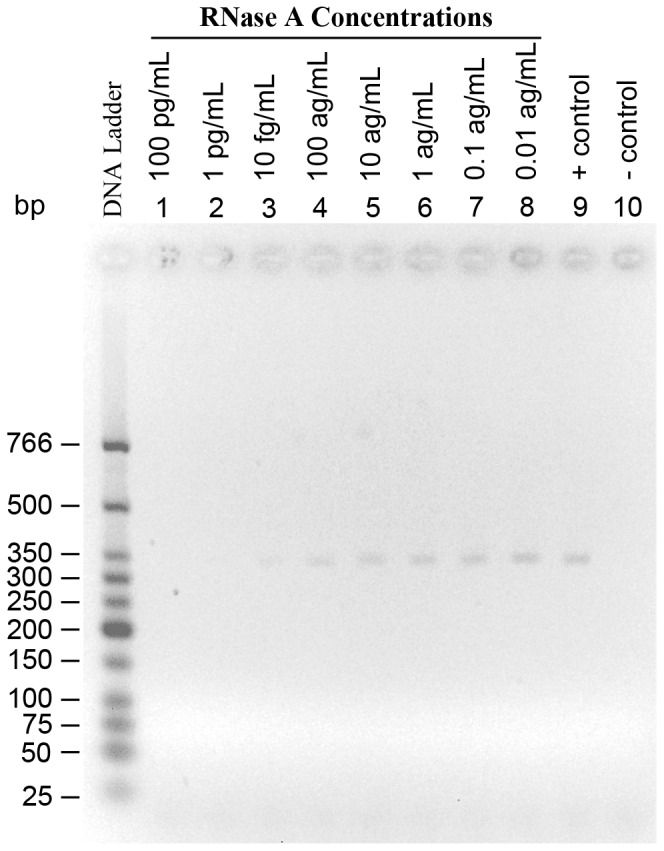
Figure 6. The detection limit of the RT-PCR based detection assay for RNase A.

Lanes 1 to 8 indicate the concentrations of RNase A. Lanes 9 is the positive control for RT-PCR which contains no RNase A. The negative control for RT-PCR, lane 10, contains no RNase A or mRNA. The concentration of mRNA is the same in lanes 1 through 9.
