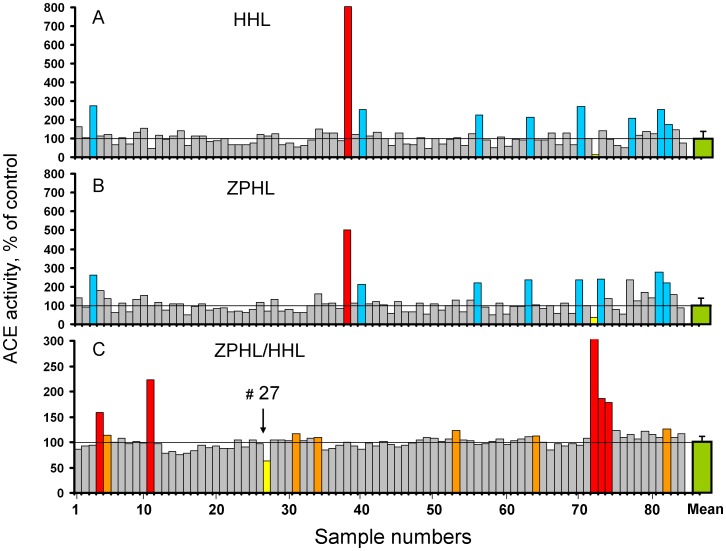
Figure 1. ACE activity in human serum.
A–B. ACE activity in 85 samples of human serum from patients with different pulmonary diseases and unrelated patients (served as a controls) - TRIDOM study, was quantified using a spectrofluorometric assay with Hip-His-Leu (A-5 mM) and Z-Phe-His-Leu (B-2 mM) as substrates. Data expressed as % of individual ACE's activity from mean value for whole population (33.0 mU/ml with Hip-His-Leu). Bars highlighted with blue - samples with values of ACE activity higher than mean + 2SD. Bar highlighted with yellow-sample # 72 with very low ACE activity –less than 30% of mean value. Bar highlighted with red-putative ACE mutation. C. Ratio of the rate of hydrolysis of the two substrates (ZPHL/HHL ratio) in the tested samples. Data expressed as % of individual ZPHL/HHL ratio from mean value for whole population (1.05+0.05). Calculation of this parameter was used primarily for identification of patients with ACE inhibitors in their blood (20): highlighted by red (high concentration) and orange (low, but detectable concentration of ACE inhibitors). Bar highlighted by yellow (and arrowed)-from patient # 27. The results are shown as mean values of duplicates. (Values of standard deviations, which were not exceeded 10%, were not shown for clarity).

