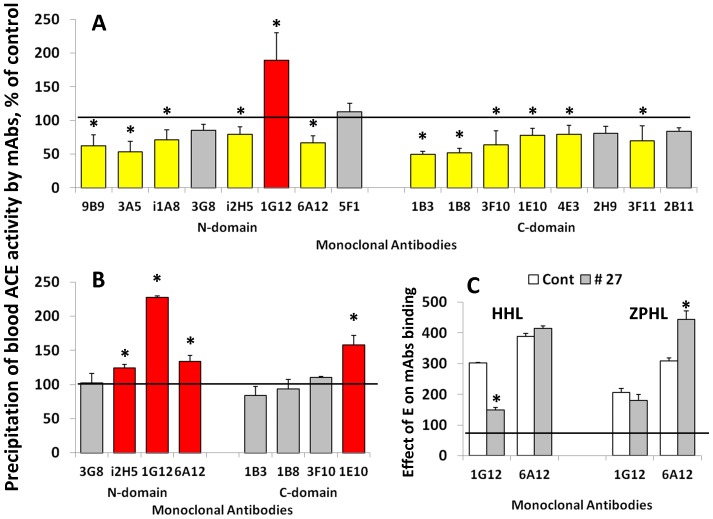
Figure 5. Conformational fingerprinting of serum ACEs with a set of mAbs to ACE.
A. Sixteen monoclonal antibodies were used to precipitate ACE from sera. Immunoprecipitated ACE activity is presented as a normalized value (“binding ratio”), to highlight differences in immunoprecipitation pattern (“conformational fingerprint”) among blood ACE from patient # 27 and blood ACE from healthy individuals (which were expressed as 100%). B. Binding of several mAbs to serum ACE from control samples and serum from patient # 27-relative to binding by mAb 9B9. Data expressed as % of mAbs/9B9 binding ratio for serum from patient # 27 to that for control serum. Bars highlighted with yellow - samples from serum of patient # 27 with values of precipitated ACE activity 20% lower than this value for control sample. Bars highlighted with red- samples from serum of patient # 27 with values of precipitated ACE activity 20% higher than this value for control sample. C. Effect of ACE inhibitor enalaprilat (100 nM) on binding of mAbs 1G12 and 6A12 to serum ACE from control samples and serum from patient # 27. All data presented as a mean of 3–5 independent determinations. * p<0.05 indicates values shown is significantly different.

