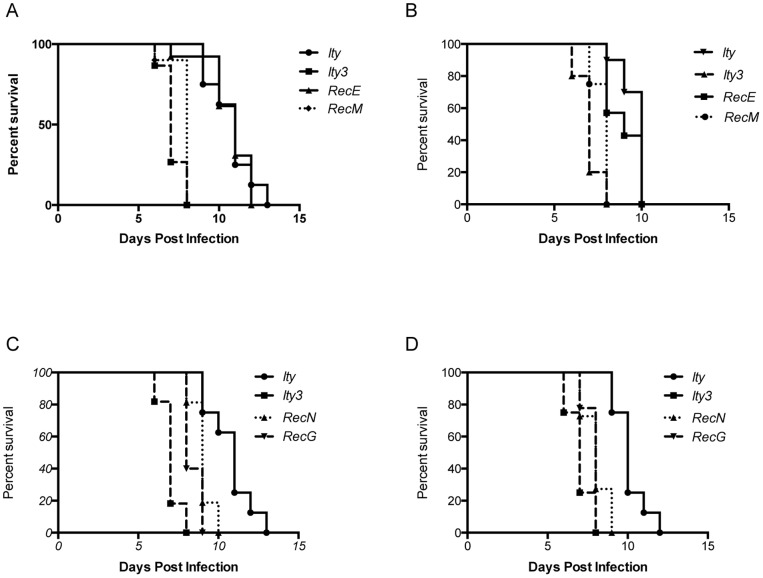
Figure 2. Survival curves of male and female congenic and sub-congenic mice after infection with Salmonella Typhimurium.
The left panel (A) and (C) show the survival of male mice after IV infection with Salmonella Typhimurium while the right panel (B) and (D) show the survival of female mice after infection. Based on the survival curves and mean survival time, strains were classified as either Ity-like or Ity3-like (A, B) Two strains, Ity3.RecN and Ity3.RecG were identified as having an intermediate phenotype (C, D). Log-Rank (Mantel-Cox) for males: p = 0.0025 Ity3.RecG versus Ity; p = 0.0035 Ity3.RecG versus Ity3; p = 0.0008 Ity3.RecN versus Ity; p<0.0001 Ity3.RecN versus Ity3. Log-Rank (Mantel-Cox) for females: p = 0.0001 Ity3.RecG versus Ity; p = 0.0520 Ity3.RecG versus Ity3; p = 0.0001 Ity3.RecN versus Ity; p = 0.0461 Ity3.RecN versus Ity3.

