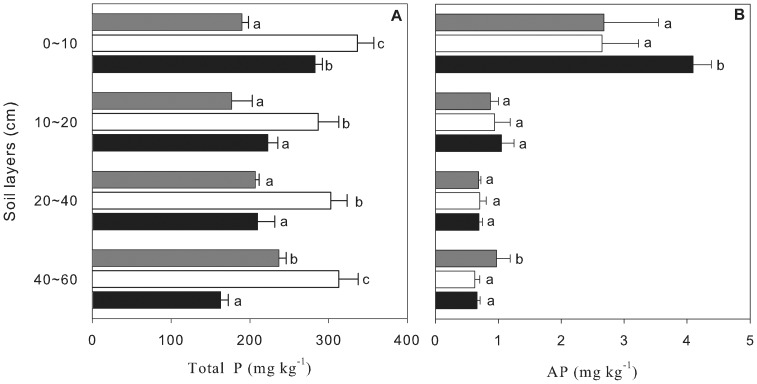
Figure 3. Soil total P and AP concentrations among three forest types at different succession stages in DBR.
Error bars indicate one standard deviation. Different letters indicate significant differences at the confidence level of P<0.05 in the same soil layer among the three forests. (OneWay ANOVA, P<0.05).

