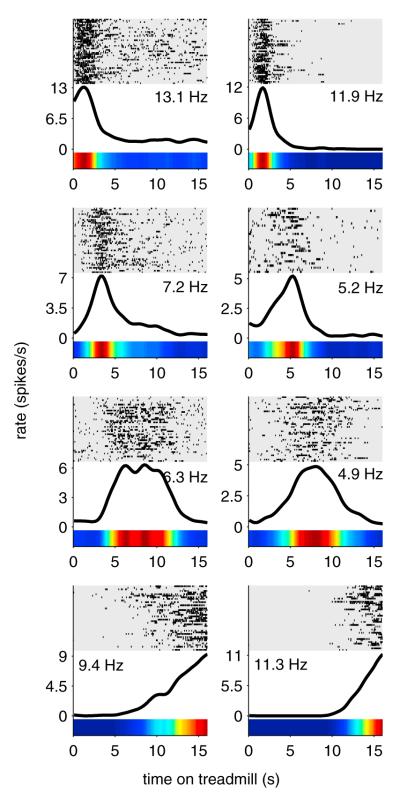
Figure 2. Treadmill Firing Fields.
Firing patterns from eight different neurons active on the treadmill during “time-fixed” sessions. Each row on the raster plots represents one run on the treadmill, aligned to the time the treadmill started. Rows are sorted with the slowest treadmill speed on top and fastest speed on bottom. Black lines and color bars represent average firing rates over all runs. Numbers indicate peak firing rates in spikes per second (Hz). See also Movie S1.

