
Figure 3. Ensemble Activity Spans Entire Treadmill Run.
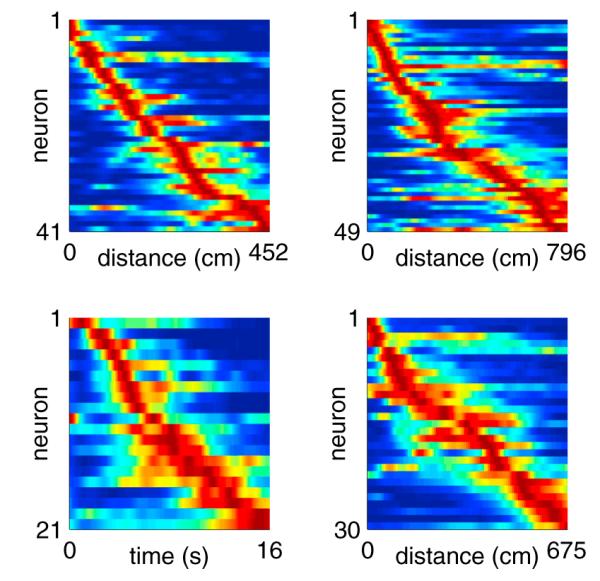
Each panel includes data from a single session. Each row represents the normalized firing rate of one neuron, sorted by the peak firing time. Neurons were included if they fired ≥0.2 Hz averaged across the entire treadmill run, with peak firing ≥1 Hz. The top two panels and bottom right panel are from “distance-fixed” sessions. The bottom left panel is from a “time-fixed” session. In each row, blue represents no firing (zero spikes per second), and red represents peak firing for that particular neuron.