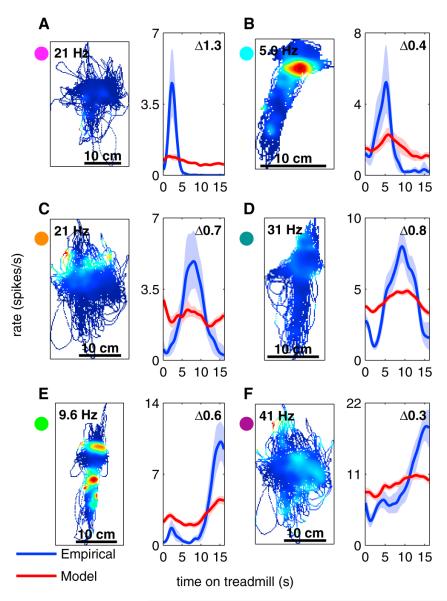
Figure 6. Spatial Activity Cannot Account for Temporal Activity.
The letters (A) through (F) indicate individual neurons recorded from different recording sessions. For each neuron there are two panels. The left panel is a spatial firing rate map, while the right panel includes two temporal tuning curves. The blue curve is the observed (empirical) temporal tuning curve of a single neuron, calculated based on the actual firing of that neuron. The red curve is the model-predicted temporal tuning curve based on the spatial firing-rate map given in the left panel of each pair. Shaded region denotes 95% confidence bounds on firing rate calculated using a bootstrap method. A bin size of 1 pixel × 1 pixel with a standard deviation of 3 pixels was used for this analysis (see Experimental Procedures). See Figure S5B for a comparison of the results from this analysis to the results from the GLM. The difference score calculated for each neuron is indicated in the upper-right corner of the right panels and in Figure S5B. The colored circles next to each neuron correspond to the colored circles in Figure S5B.

