
Figure 8. GLM Comparison of Time versus Distance.
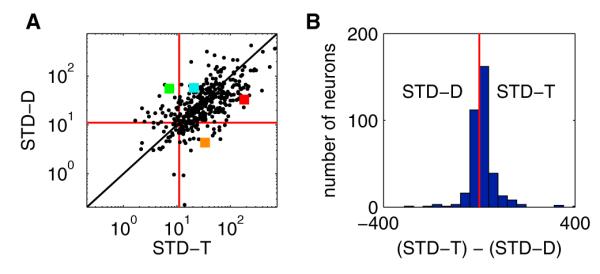
(A) x values are the deviances of the space and distance (“S+D”) model from the full (“S+T+D”) model (the result of removing time from the full model, hence the label “STD-T”). A larger x value indicates a more significant contribution from time. y values are the deviances of the space and time (“S+T”) model from the full (“S+T+D”) model (the result of removing distance from the full model, hence the label “STD-D”). A larger y value indicates a more significant contribution from distance. Each point represents a single neuron. The red lines indicate the minimum thresholds for significance. Points in the upper-right quadrant had a significant influence of both distance and time. Points in the upper-left quadrant had a significant influence of just distance. Points in the lower-right quadrant had a significant influence of just time. Points in the lower-left quadrant were not significantly influenced by either time or distance. Points along the diagonal have an equal contribution from distance and time. Colored squares correspond to the examples shown in Figure 7.
(B) Histogram of the y values from (A) subtracted from the x values from (A). More positive values indicate a larger contribution from time; more negative values indicate a larger contribution from distance. Red line is at 0 (equal contribution of time and distance, the diagonal line in (A)). This figure shows that while the majority of neurons were influenced by both time and distance, individual neurons varied in their degree of tuning to either time or distance, with some neurons responding exclusively to time and other neurons responding exclusively to distance.
See Figure S4 for additional results from the GLM. See Figure S5B for a comparison of the results from the GLM to the results from Figure 6.