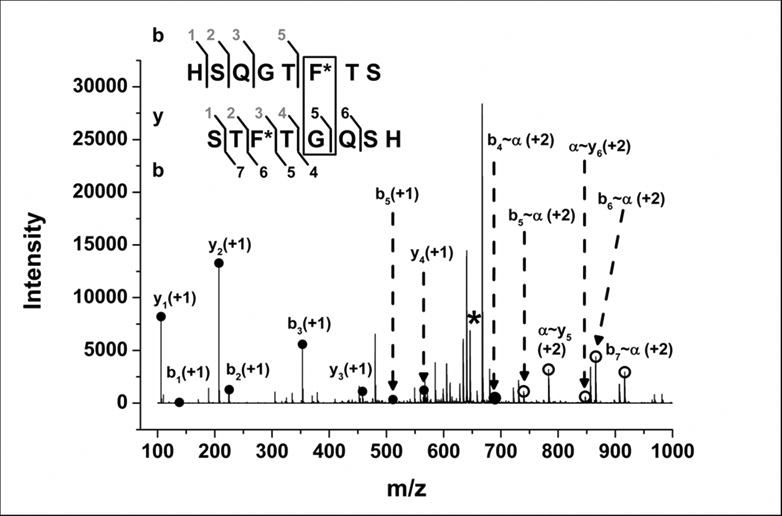
Figure 6.

MS/MS spectrum of GCG (1-8)* dimer in the lyophilized formulation with L-Leucine showing b- and y-ion products obtained by CID fragmentation. The asterisk denotes the precursor dimer peak (m/z = 646.28). Closed circles represent simple (non-cross-linked) b- and y-ions. Open circles represent cross-linked b- and y-ions, labeled as b∼α and α∼y. Inset shows b- and y-ion sequences for internal fragment ions (numbered in grey) and cross-linked ions (numbered in black) detected.
