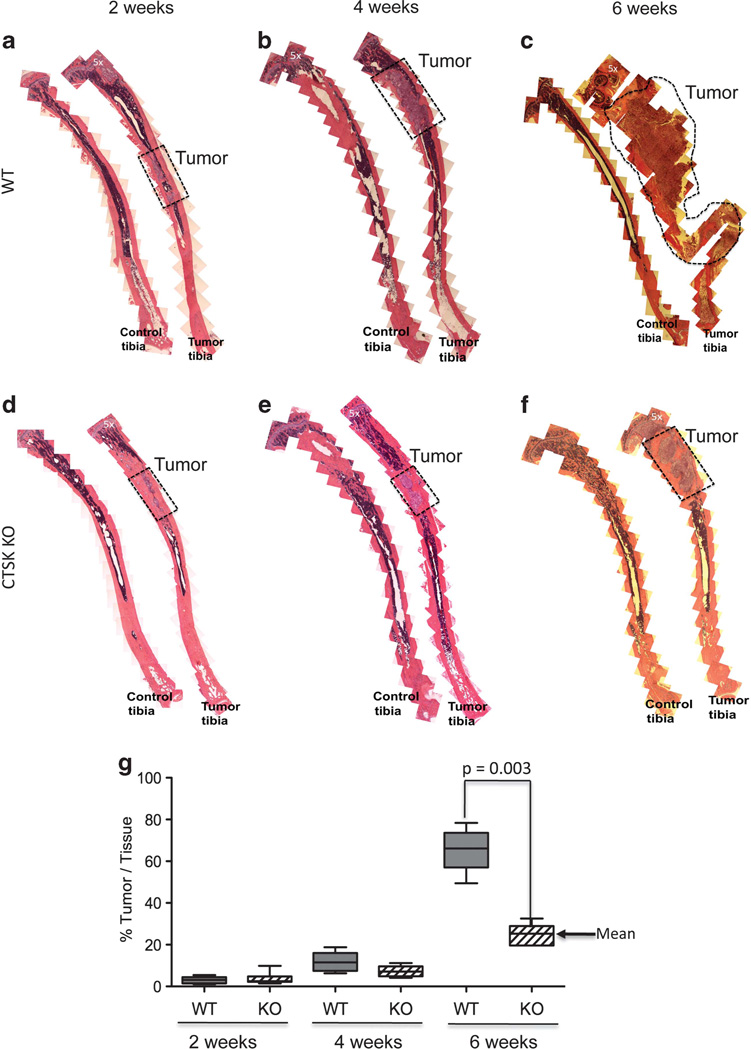
Figure 2.
Histological changes reflect slower tumor progression and delayed bone resorption in CTSK-deficient mice. (a–f) Histological analysis of control and tumor-bearing tibia from WT (a–c) and CTSK KO (d–f) mice at 2, 4 and 6 weeks post tumor cell implantation (n>6 mice/group/time point). Composites of multiple × 5 images were used to show entire cross-sections of control and tumor-bearing tibia. Areas occupied by tumor are marked by dotted line. Magnified ( × 40) images of representative sections of tumor area are shown in Supplementary Figure 1. (g) Box and whisker plot showing percentage of tissue occupied by tumors at 2, 4 and 6 weeks. Ratios were calculated by the Axiovision (Zeiss) software based on the measurement of the corresponding areas in µm2. The data for each time point are representative of at least six mice. Results were analyzed by Mann–Whitney test; P = 0.003 indicates reduced tumor growth in CTSK KO mice.

