Figure 7.
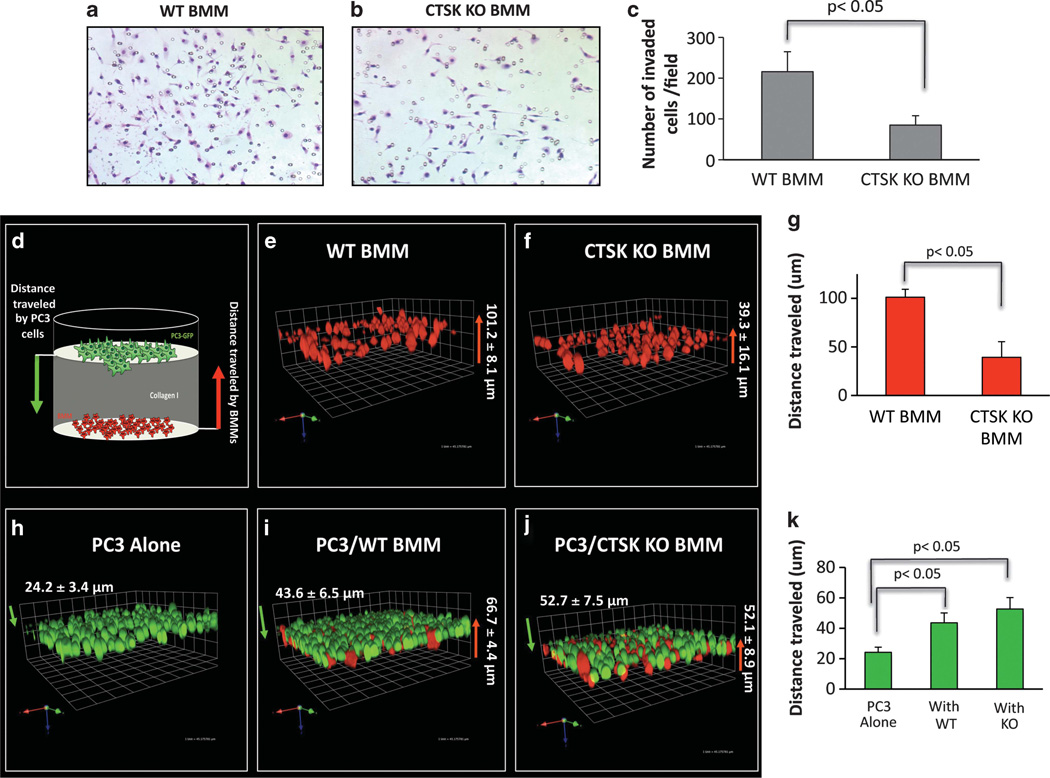
Macrophage invasion is impaired in the absence of CTSK. BMM invasion through collagen I. Micrographs of Diff-Quik stained invasion filters for WT (a) and CTSK KO (b) BMMs. (c) Quantification results showing numbers of invaded cells. Data are shown as number of invaded cells/field±s.d. (mean of 6 fields) and are representative of three experiments. (d) Cartoon of 3D invasion assay through collagen I. Cell Tracker Orange-labeled BMMs (red) are seeded on the bottom of the dish, overlayed with collagen I, and PC3-EGFP (green) cells are seeded on top. Cells are allowed to invade for 48h and distance traveled by each cell type is measured as described in Materials and methods using Volocity software. The 3D reconstruction of Z-stack optical images of: WT BMM culture (e), CTSK KO BMM culture (f), PC3 culture (h), co-culture of PC3 cells with WT BMM (i), co-culture of PC3 cells with CTSK KO BMM (j). The WT BMMs are more invasive than CTSK KO cells (g; 101.2µm vs 39.3 µm). The PC3 invasion was increased by both the WT and the CTSK KO BMMs (k). The interaction of WT BMMs with PC3 cells occurred closer to PC3 origin (43.6 µm) than interaction of CTSK KO BMMs (52.7 µm), further confirming impaired CTSK KO invasiveness.

