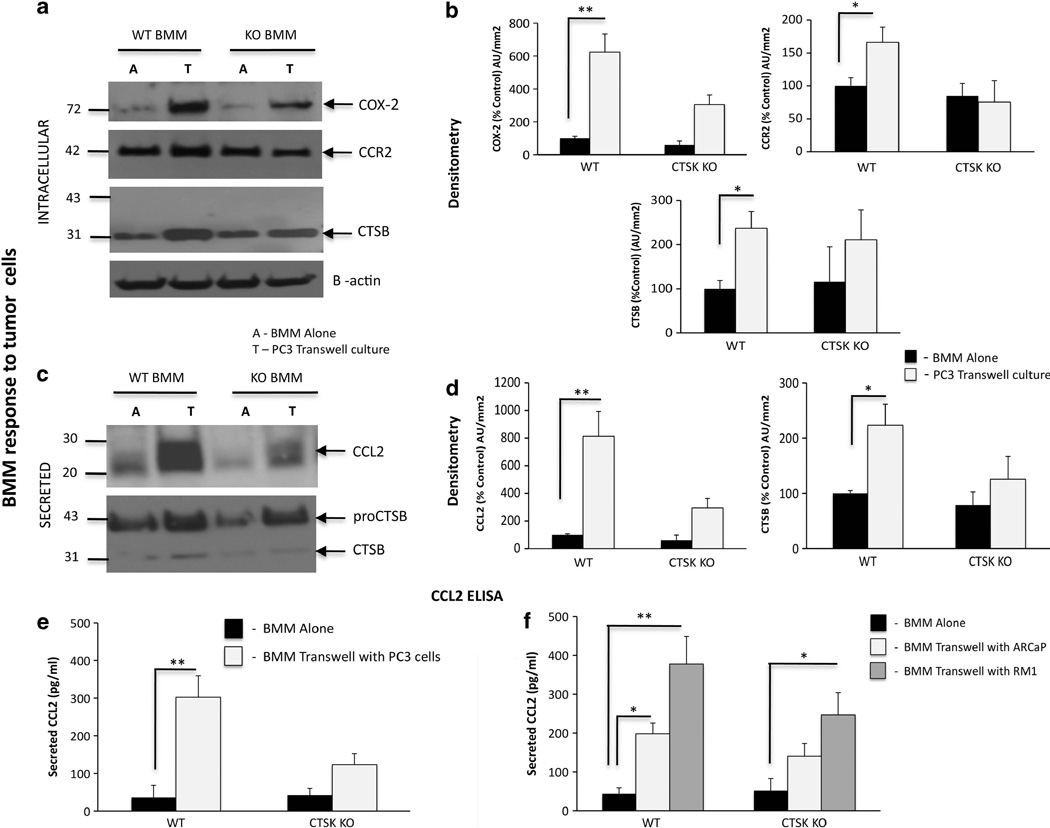
Figure 8.
Interaction of WT BMMs with prostate tumor cells leads to upregulation of BMM-derived COX-2, CTSB and CCR2/CCL2 axis. WT and CTSK KO BMMs were cultured alone (A) or in a transwell system (T) with PC3 (a–e), ARCaP(M) or RM-1 cells (f). (a–d) PC3 lysates and media were collected for immunoblot analyses of intracellular: (a) COX-2 (top), CCR2 (middle) and CTSB (bottom), and secreted (c) CCL2 (top) and CTSB (bottom). Samples were loaded based on DNA in cell lysates. β-actin was used as a loading control. Data are representative of three experiments. Densitometric analysis of intracellular (b) COX-2, CCR2 and CTSB and secreted (d) mouse CCL2 and CTSB normalized to β-actin in corresponding cell lysates. Black bars: BMM alone, gray bars: BMM in transwell co-culture. Data are expressed as % control (BMM alone) of arbitrary units per square millimeter, and are representative of at least three experiments. (e, f) CCL2 ELISA assay results for WT and CTSK KO BMMs grown in a transwell system with PC3 cells (e) and ARCaP(M) and RM-1 cells (f). Media samples from three replicate wells/condition were diluted based on DNA concentrations in cell lysates. Supernatant volume corresponding to 100 ng DNA in cell lysates was used in each well and assayed in duplicate. Data are expressed in pg/ml±s.d.; P-values of 0.05* and 0.001** are considered statistically significant.

