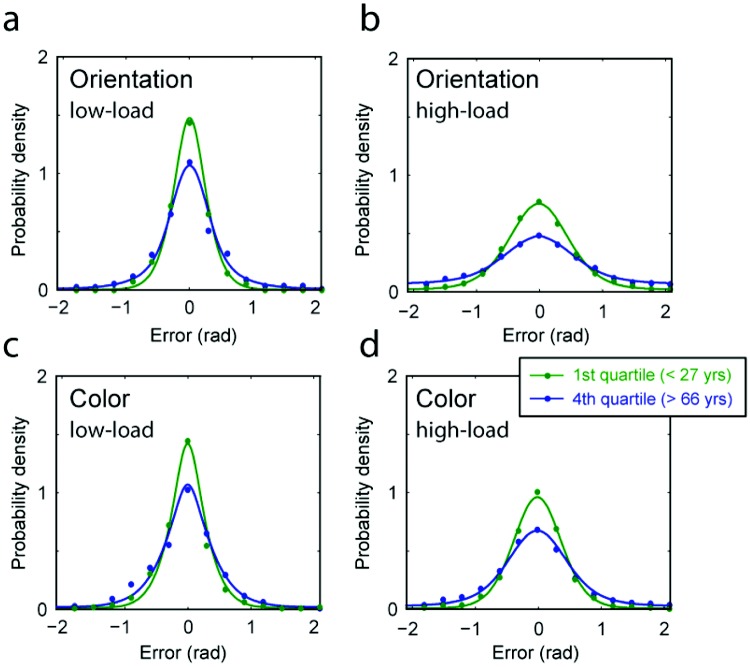
Figure 2.
Distribution of errors for young and old participants. (a–b) Frequency of response as a function of the deviation between reported and target orientations, for participants in the youngest (green symbols) and oldest (blue symbols) age quartiles. Results are shown for [low-load, one memory item, (a); high-load, three memory items, (b)] conditions. Colored lines indicate the response probabilities predicted by a fitted probabilistic model of response generation. Note the increase in response variability (width of the distribution) for older participants. (c–d) Corresponding results for recall of color.

