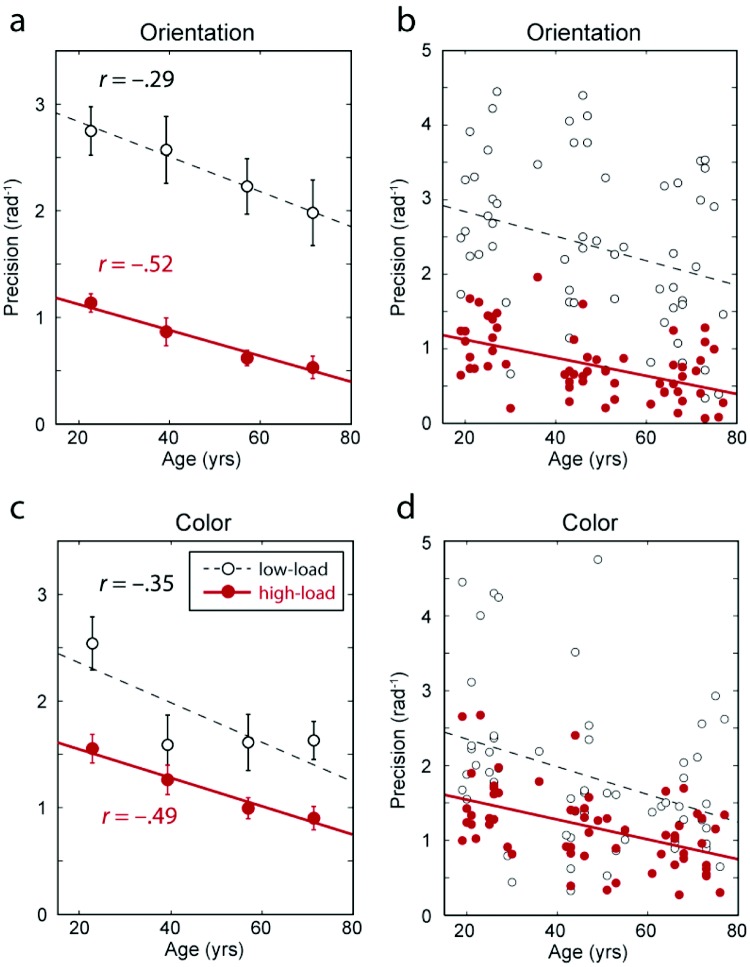
Figure 3.
Age effects on recall precision. (a–b) Precision of orientation recall as a function of age, for low-load (black) and high-load (red) conditions. Symbols and errorbars in (a) indicate mean ± 1 SE for each age quartile. Individual subject results are plotted in (b). Precision is here defined as the reciprocal of the standard deviation of error in participants’ responses; zero indicates chance performance. Fitted regression lines are shown for the relationship between precision and age. (c–d) Corresponding results for color recall.

