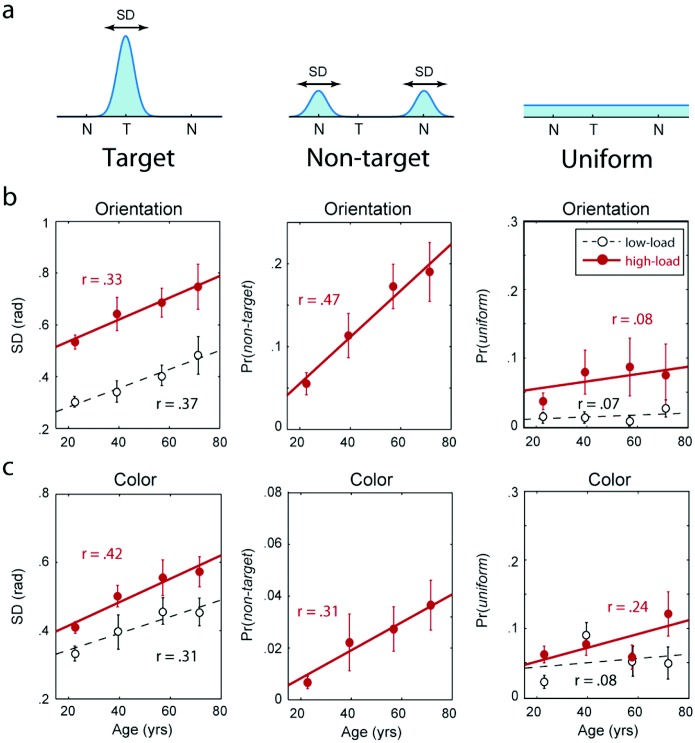
Figure 4.
Components of error in the working memory task. (a) The distribution of responses in each feature dimension was decomposed into a mixture of three separate components: responses distributed with Gaussian variability around the correct target (T) feature value (left), responses distributed around the feature values of other, nontarget (NT) items in the memory array (center), and responses uniformly distributed throughout the response space (right). (b–c) Maximum likelihood estimates of parameters of the mixture model illustrated above, for orientation responses (b) and color responses (c). Fitted regression lines illustrate relationships between each model parameter and age. Gaussian variability in target responses (left) increases with age, as does the frequency of nontarget responses in multiitem arrays (center). The frequency of random responses (right) is not correlated with age. Error bars indicate ± 1 SE.

