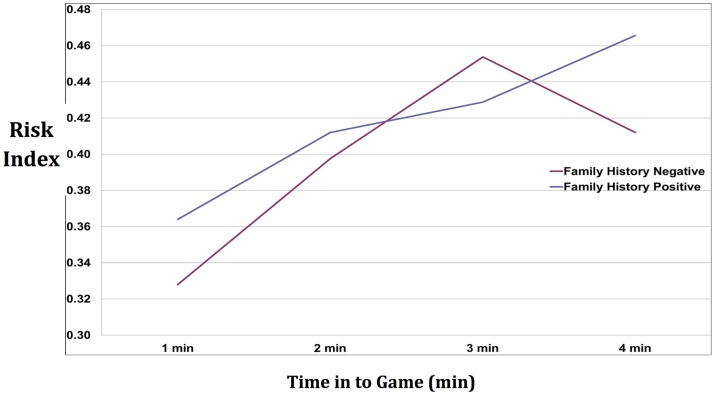
Figure 2. Risk indices by group (Family History Positive and Family History Negative) over time in to game.
Risk Index was derived by dividing number of non-match choices by number of total choices when non-match and match choices were available to the player. FHP (a) and FHN (b) data are plotted by minute into game with standard error (averaged for all games for all subjects). No significant differences were found between groups. There was a significant main effect of time across groups (F = 9.58, df = 3, 201, p<.0001).

