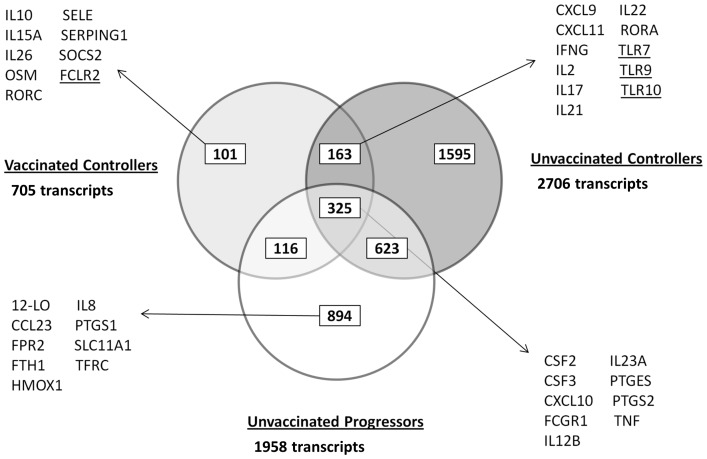
Figure 2. Comparison of differentially expressed gene lists across experimental groups.
Microarray analysis was used to identify differentially expressed genes in PPD-stimulated PBMCs isolated at 6 weeks post-challenge with M. tuberculosis from vaccinated controllers (n = 6), unvaccinated controllers (n = 3) and unvaccinated progressors (n = 3) compared with expression when animals were naïve. Key genes of interest in each list are indicated. Underlined genes were down-regulated in expression from naïve time-points.

