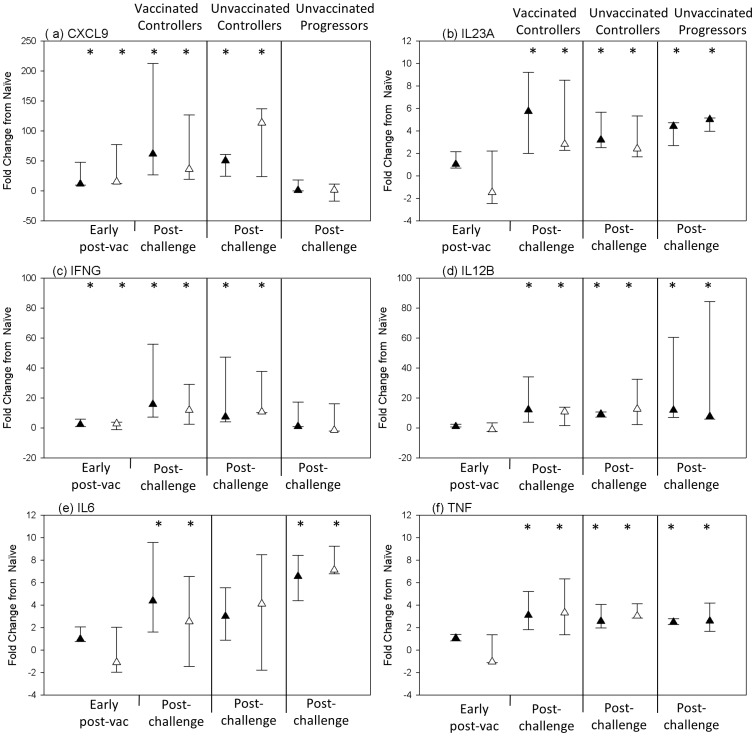
Figure 4. Comparison of gene expression profiles generated from microarray and RT-PCR analysis.
RT-PCR was used to validate microarray expression data. The symbol represents the median and the error bars represent the range. Black triangles represent fold change in expression from naïve time-points as determined by microarray analysis; white triangles represent fold change in expression from naïve time-points as determined by RT-PCR analysis. * = differentially expressed (p<0.05).

