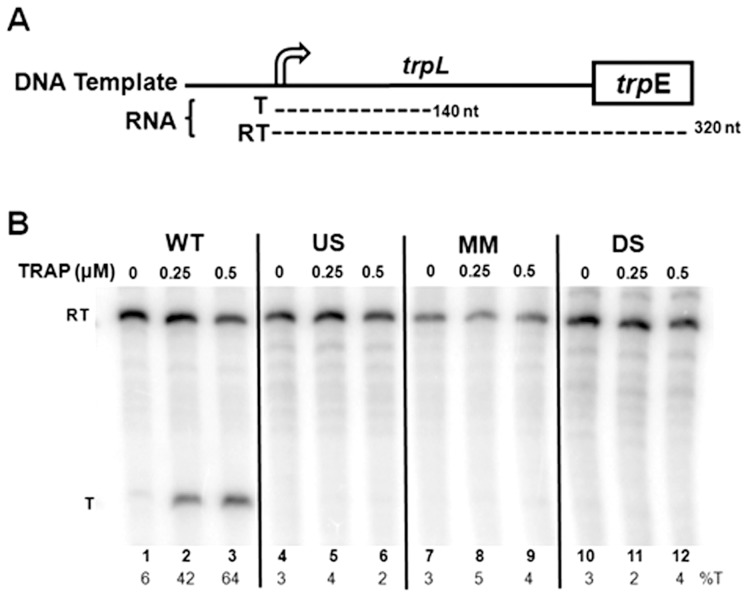
Figure 5. In vitro transcription attenuation assays.
(A) Diagram of DNA templates used for in vitro transcription attenuation assays. The two major transcripts produced from these templates include read through (RT; ∼140 nts) and terminated (T: ∼320 nts) transcripts are shown below the diagram of the template. (B) 6% polyacrylamide-8M urea gel electrophoresis analysis of the products of in vitro transcription of the wild type (WT), U-stretch (US), mismatch stem (MM), and disrupted stem (DS) templates in the absence and presence of 0.25 or 0.5 µM TRAP. Positions of read through (RT = 320 nt) and terminated (T = 140 nt) transcripts are indicated at left side of the figure. The percentage of transcripts terminating at the attenuator (%T) for each reaction is shown at the bottom of each lane.

