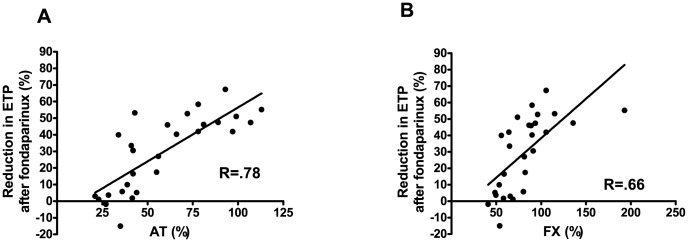
Figure 3. Correlation between AT/FX levels and reductions in thrombin generation after fondaparinux.

Correlation between the percentual reduction in ETP when tested in the presence of TM after addition of 0.5 µg/ml fondaparinux and (A) plasmatic AT levels and (B) plasmatic FX levels in plasma from patients with cirrhosis.
