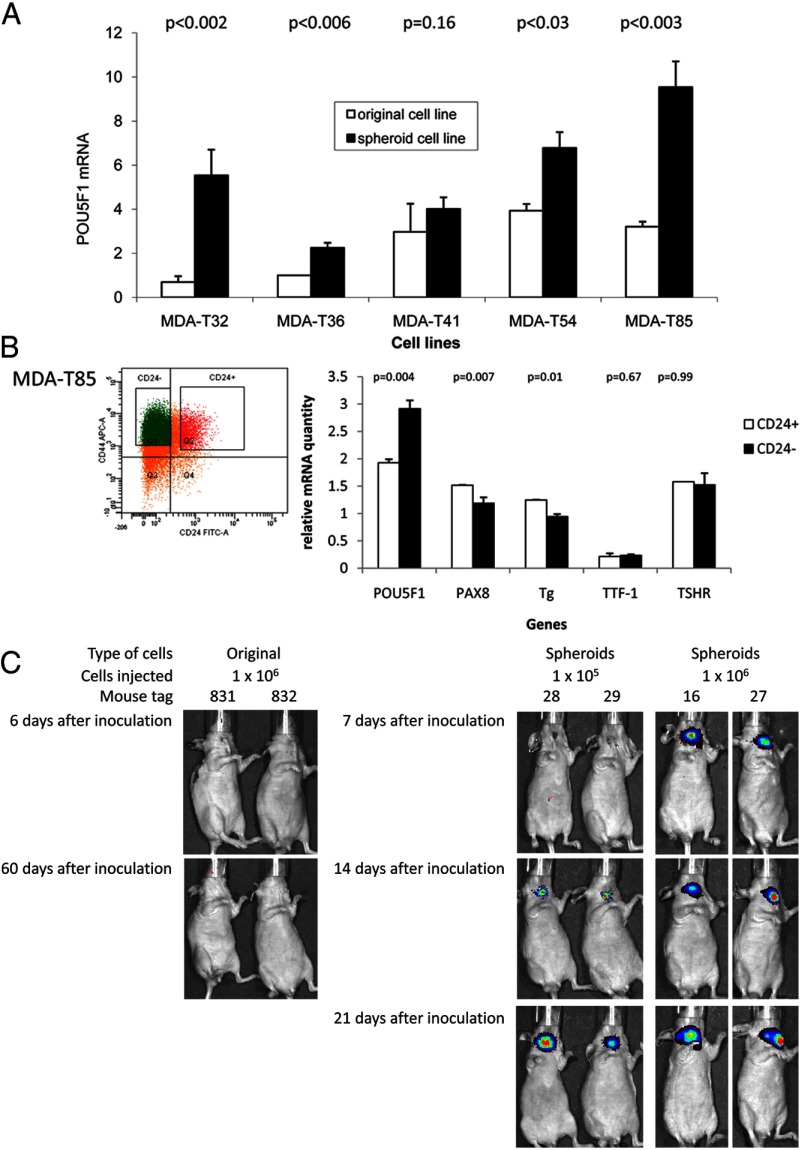
Figure 3.
High expression of POU5F1 and tumorigenesis in thyrospheroids. A, Total RNA was prepared from MDA-T32, MDA-T36, MDA-T41, MDA-T54, and MDA-T85. Real-time PCR was used to detect the expression of POU5F1 in both original and spheroid cell lines. The amount of POU5F1 mRNA was quantified to 18S RNA as described in Materials and Methods and normalized to the fold of expression over that in MDA-T36 original cell line. B, Flow cytometry was performed in MDA-T85 thyrospheroids to isolate CD44+CD24+Lin- and CD44+CD24-Lin- cells (left panel). Total RNA was prepared and real-time PCR was used to determine the relative quantity of POU5F1, PAX8, Tg, TTF-1, and TSHR mRNA through a standard curve in both CD44+CD24+Lin- and CD44+CD24-Lin- populations (right panel). The values of PAX8, Tg, TTF-1, and TSHR mRNA have been amplified 1000, 100, 1000, and 1000 times, respectively, to be in the same scale as POU5F1 mRNA. The relative quantity of mRNA was quantified to 18S RNA as described in Materials and Methods. C, Original cells of MDA-T32 (1 × 10⁶ cells) were inoculated into the thyroid of immunodeficient mice (tags number 831 and number 832). Xenogen luciferase bioimaging was performed 6 and 60 days after inoculation. MDA-T32 thyrospheroid cells were inoculated in immunodeficient mice orthotopically using 1 × 10⁵ (tags number 28 and number 29) or 1 × 10⁶ cells (tags number 16 and number 27). Xenogen luciferase bioimaging was shown on 7, 14, and 21 days after inoculation.

