
Figure 1.
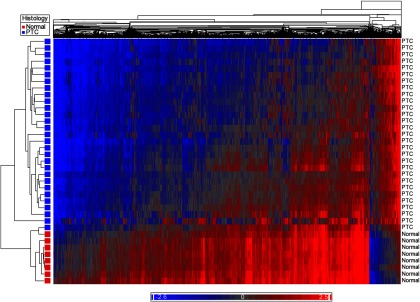
Heat map demonstrating global hypomethylation of PTC compared with normal thyroid tissue. Blue represents hypomethylated loci, and red represents hypermethylation.
Official websites use .gov
A
.gov website belongs to an official
government organization in the United States.
Secure .gov websites use HTTPS
A lock (
) or https:// means you've safely
connected to the .gov website. Share sensitive
information only on official, secure websites.
Heat map demonstrating global hypomethylation of PTC compared with normal thyroid tissue. Blue represents hypomethylated loci, and red represents hypermethylation.