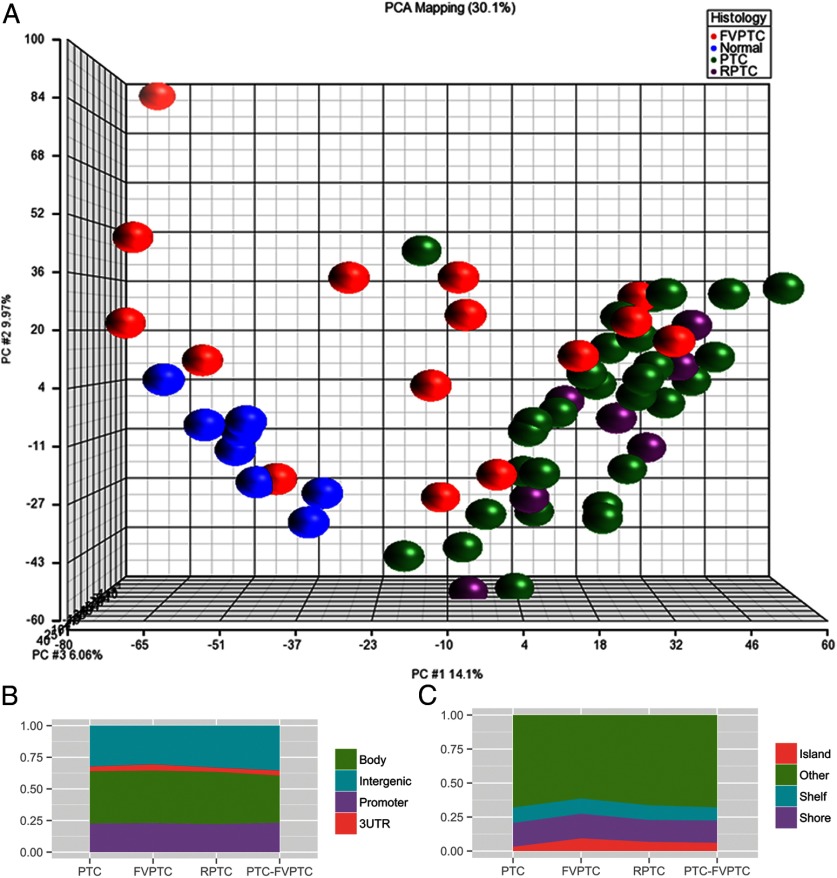
Figure 2.
A, Principal component analysis of normal, FVPTC, primary PTC, and recurrent PTC, using ANOVA and adjusted P ≤ .01. Primary and recurrent PTC samples cluster separately from normal samples. B, Distribution of differentially methylated CpG sites between promoter, gene body, 3′UTR, and intergenic regions by tumor histology. C, Distribution of differentially methylated sites relative to CpG islands by histology. RPTC, recurrent PTC.

