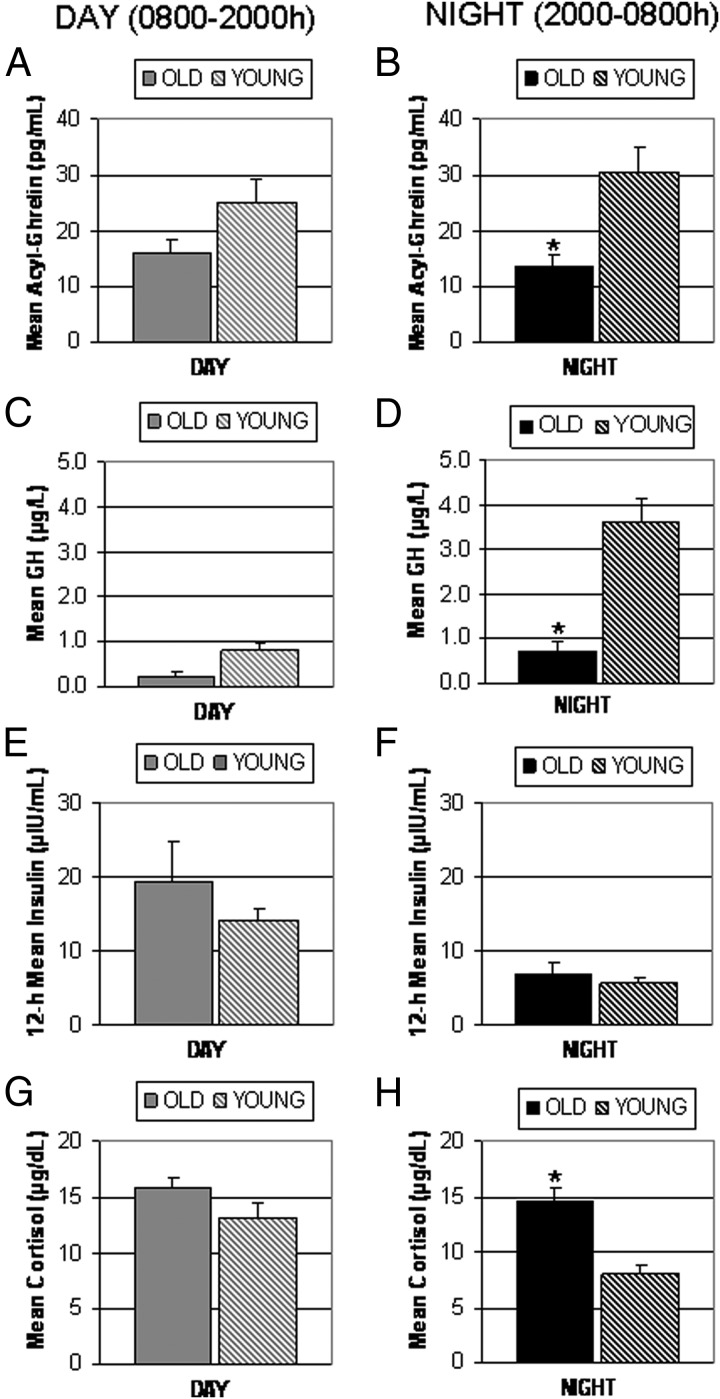
Figure 3.
Comparison of 12-hour mean (±SEM) concentrations of acyl-ghrelin (panels A and B), GH (panels C and D), insulin (panels E and F), and cortisol (panels G and H) during the day (8:00 am to 800 pm) (left column) and night (8:00 to 8:00 am) (right column) in six old and eight young adults on a fed admission; standardized meals at 8:00 am, 1:00 pm, and 6:00 pm. *, P < .005 old vs young.

