Figure 2.
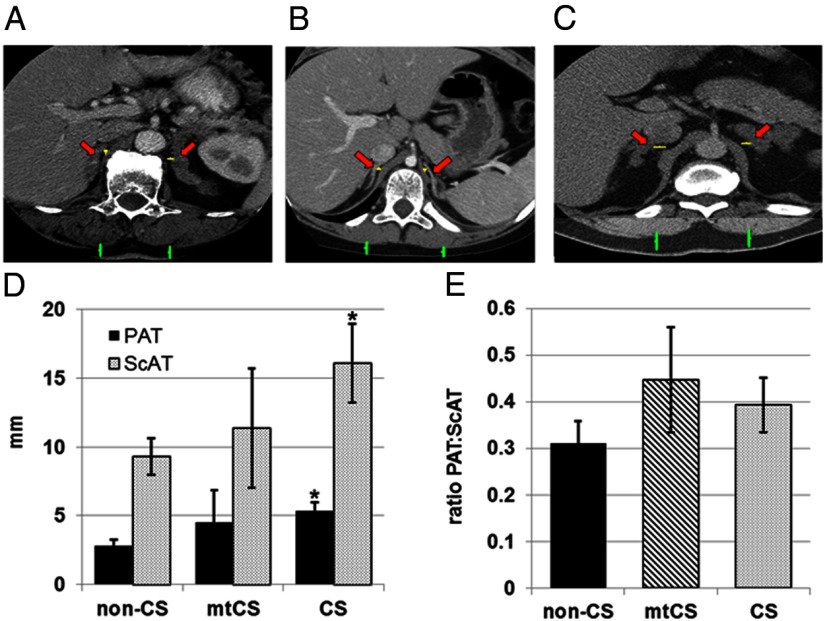
ScAT and PAT were quantified from preoperative abdominal CT scans. A–C, Representative preoperative abdominal CT scans of patients are shown and include a patient with APA (non-CS) (A), a patient with CS with a PRKAR1A mutation (mtCS) (B), and a patient with CS without a PRKAR1A mutations (CS) (C). Red arrows indicate the right and left adrenal glands, yellow bars show the distance between the medial limb of each adrenal gland and the crux of the diaphragm that was measured as PAT, and green bars indicate the thickness of ScAT measured in each patient. D and E, Mean values for PAT and ScAT (D) and the ratio of PAT to ScAT (E) were calculated in non-CS, mtCS, and CS groups. The data set includes patients for whom digital CT scans were available: APA, n = 4; mtCS, n = 4; and CS, n = 9. *, P ≤ .05. Comparisons were made in reference to the non-CS group and within classification only.

