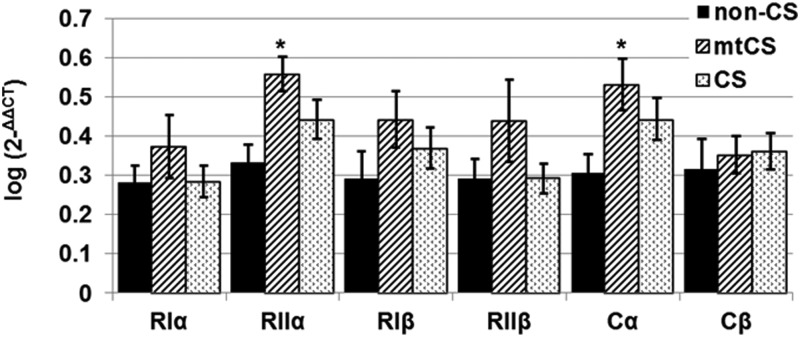
Figure 3.
mRNA expression of PKA subunits RIα, RIIα, RIβ, RIIβ, Cα, and Cβ in PAT of groups: non-CS (APA) and CS with (mtCS) and without PRKAR1A mutations (CS). qRT-PCR data were log-transformed to achieve normality, and values are presented as means (log) ± SEM. *, P < .05. The data set includes samples from the following: non-CS (n = 8), mtCS (n = 12), and CS (n = 25).

