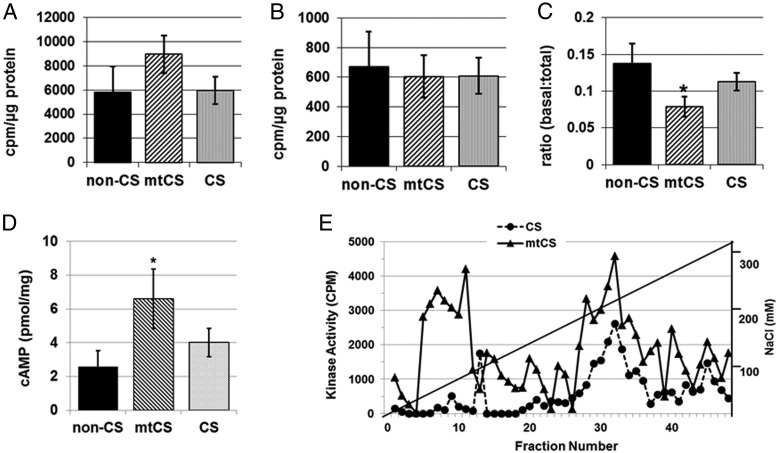
Figure 4.
Effects of CS or CS with PRKAR1A mutations (mtCS) on the PKA signaling pathway were assessed in PAT by measuring PKA activity and cAMP levels. A–E, cAMP-stimulated PKA activity (A), basal PKA activity (B), the ratio of basal to total PKA activity (C), cAMP concentrations (D), and cAMP-stimulated DEAE assay (E) of PAT samples from CS and non-CS groups. Data presented are means ± SEM. *, P < .05.

