
Fig. 1.
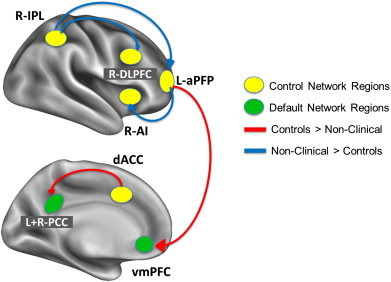
Between and within network connectivity in the comparison of controls and NCP participants. Seed regions are represented by ovals, with control network (fronto-parietal or cingulo-opercular) regions shown in yellow and default mode network regions shown in green. Red connectivity lines denote stronger connectivity for controls compared to NCP, and blue connectivity lines denote stronger connectivity for NCP compared to controls.