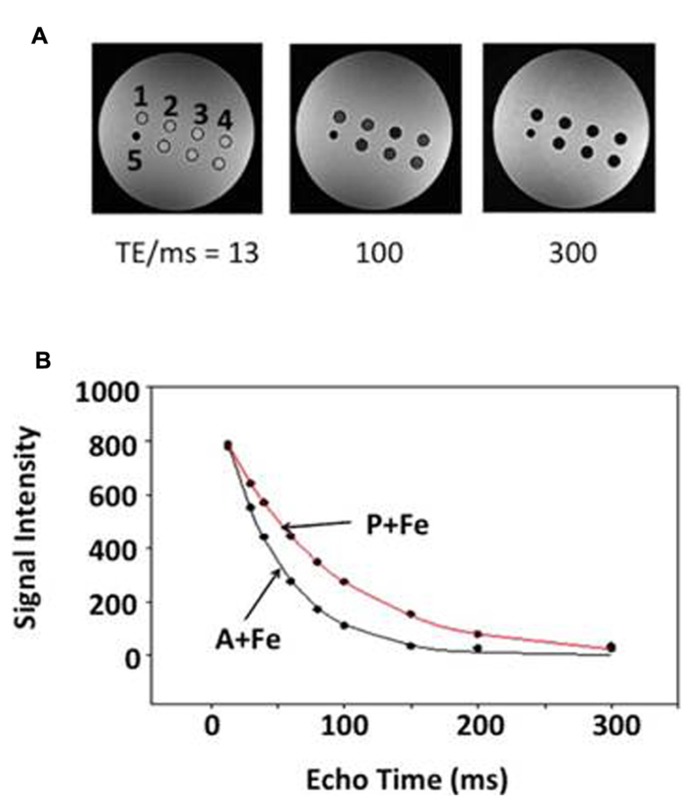
FIGURE 1.
Relaxation rate measurement in a spherical phantom. Representative data indicate the influence of echo time (TE) on signal decay. (A) Single-echo SE images show sample wells in cross section at three different TE values (13, 100, and 300 ms): 1, parental (P); 2, MagA (A); 3, iron-supplemented MagA (A + Fe); 4, iron-supplemented parental (P + Fe); and 5 polystyrene marker for reference. Samples along the bottom row are combinations of MagA-expressing and parental cells. (B) R2 relaxation curves are shown for iron-supplemented samples. Symbols indicate the mean signal intensity within a region of interest (ROI) at each TE. Curves represent the best fit to an exponential decay.

