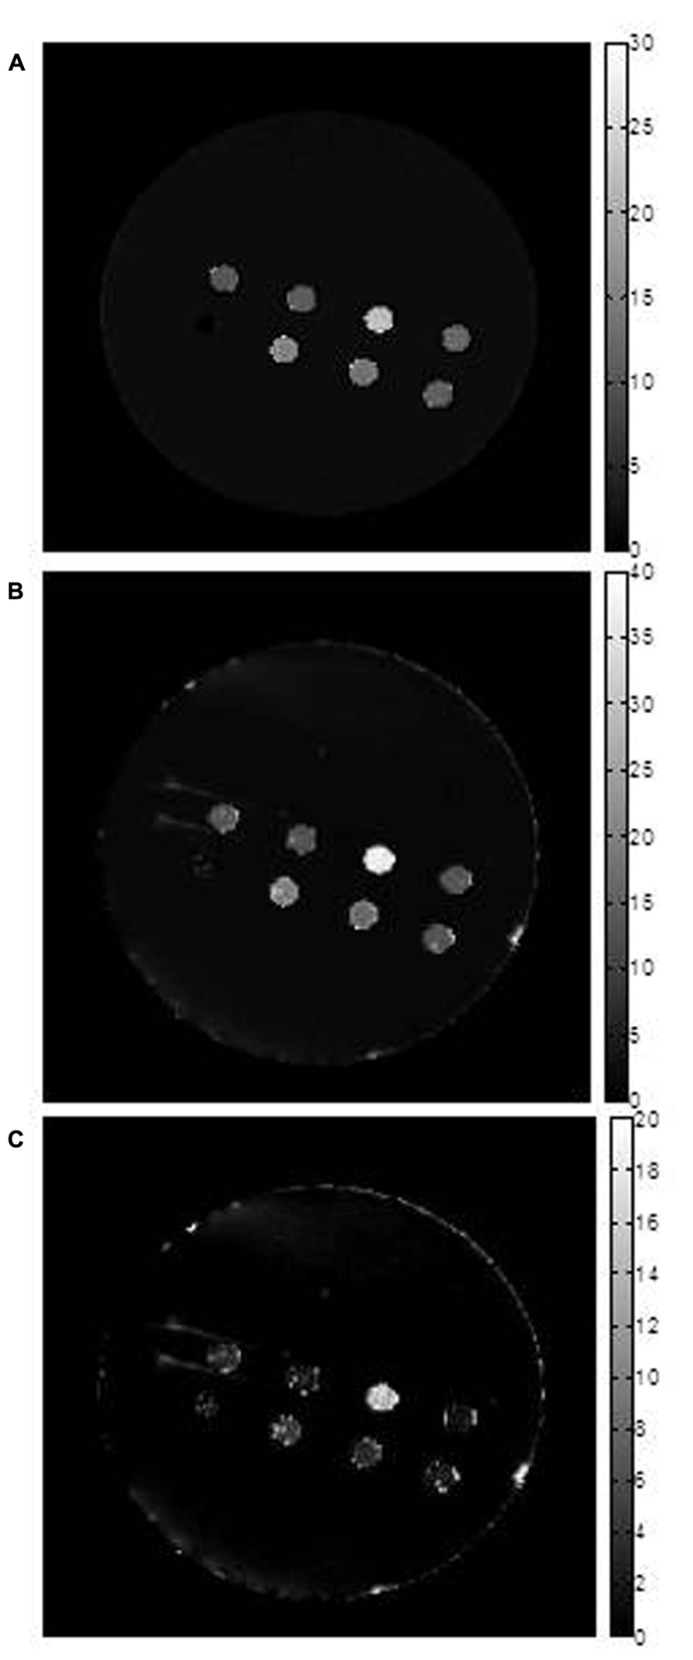
FIGURE 2.
Transverse relaxation rate mapping. Representative maps are shown for (A) R2, (B) R2* and (C) R2’. The first two maps were obtained using voxel by voxel curve fitting with an exponential decay function and the R2’ map was obtained by subtraction (R2*–R2). The units of the scale bar are sec-1. Images show sample wells in the phantom, in cross section. From left to right across the top row are: parental (P); MagA (A); iron-supplemented MagA (A + Fe); and iron-supplemented parental (P + Fe). Along the bottom row, from left to right, there is a polystyrene marker for reference and samples with combinations of iron-supplemented, MagA-expressing and parental cells. These samples decrease from 70% A + Fe to 50% and 30% and were not further evaluated. Note that pixel values for all three rates are highest for A + Fe. Maps are provided for display only; relaxation rates (Table 2) were determined as outlined in methods.

