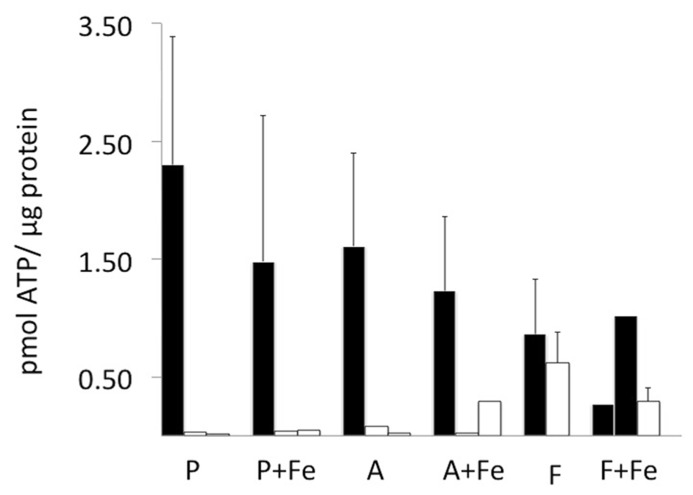
FIGURE 3.
Cellular ATP content before and after MR scanning. ATP was quantified in each cell type using a luciferase bioluminescence assay and normalized to protein content (black bars). In parental and MagA-expressing cells, ATP content was not statistically different in the presence and absence of iron supplementation. In cells mounted in a gelatin phantom (open bars), the ATP content decreased variably within 24 h of harvest and scanning. Error bars represent SEM where n = 3–4; both values are shown where n = 2.

