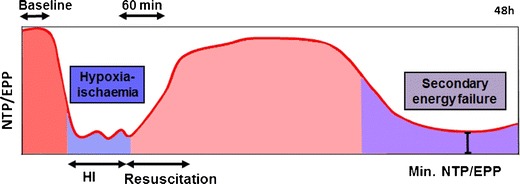
Fig. 3.

Schematic diagram illustrating the biphasic pattern of energy failure associated with a transient hypoxia–ischemic insult visualized using 31P MRS in the UCL piglet model. Nucleotide triphosphate (NTP)/exchangeable phosphate pool (EPP = Pi + PCr + NTP) is shown on the y-axis. The change in NTP/EPP during transient hypoxia–ischemia (HI), resuscitation, the latent phase (period between the recovery from acute HI and the evolution of secondary energy failure (SEF)), and SEF itself are shown. During the acute energy depletion, some cells undergo primary cell death, the magnitude of which will depend on the severity and duration of HI. Following perfusion, the initial hypoxia-induced cytotoxic edema and accumulation of excitatory amino acids typically resolve over 30–60 min with apparent recovery of cerebral oxidative metabolism (latent phase). It is thought that the neurotoxic cascade is largely inhibited during the latent phase and that this period provides a “therapeutic window” for therapies such as hypothermia and other agents. Cerebral oxidative metabolism may then secondarily deteriorate 6–15 h later (as SEF). This phase is marked by the onset of seizures, secondary cytotoxic edema, accumulation of cytokines, and mitochondrial failure
