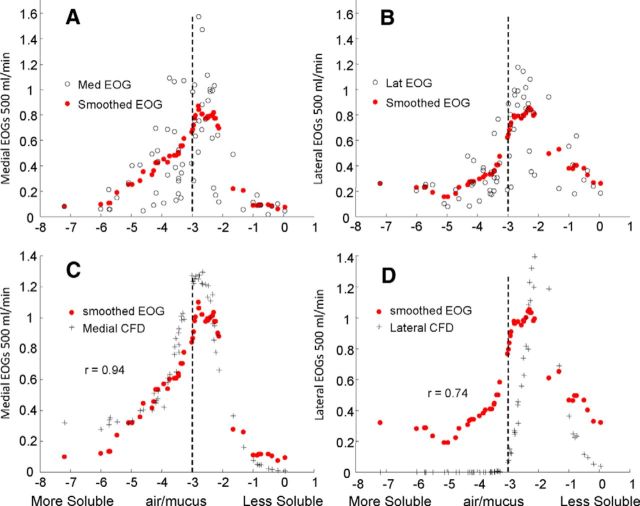
Figure 4.
Comparison of smoothed EOG records and odorant concentrations. A, B, Intact medial and lateral EOG at orthonasal 500 ml/min compared with a moving average, where EOG values to odorants with similar mucosa solubility values (±0.5 log unit) are averaged. This average serves to remove the variabilities (neuronal, experimental, etc.) that are unrelated to sorption. C, D, The moving average response is compared with the CFD-calculated concentrations. In each case, the values are normalized to the value for isoamyl acetate. The vertical dotted lines corresponding to log(air/mucus) values of −3 help to compare the peaks with those in previous figures.

