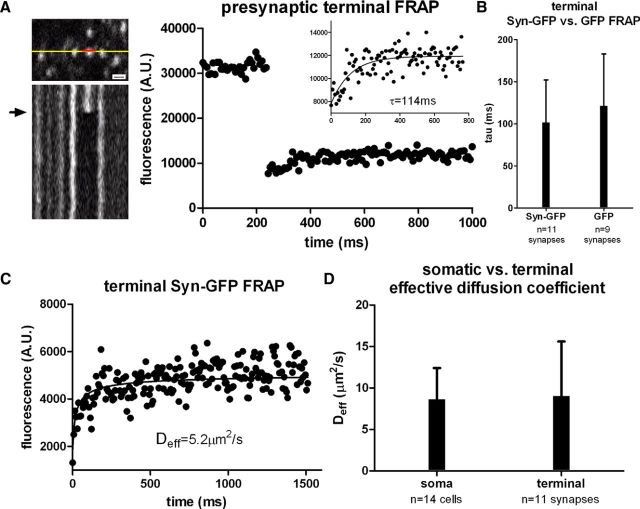
Figure 3.
Fast synaptic terminal in vivo multiphoton FRAP imaging. A, Left, Top, Set of cortical terminals expressing Syn-GFP is shown with line representing location of line scan used for imaging (yellow) and bleaching (red). Scale bar, 1.5 μm. Bottom, X–T plot of line scan data showing baseline, bleach (arrow), and postbleach recovery. Right, Individual terminal fluorescence before and after bleaching pulse with single exponential fit to FRAP recovery curve (inset). B, Group data of calculated tau values for Syn-GFP and GFP-only expressing terminals. C, Individual terminal Syn-GFP FRAP recovery data fit to extract the value for Deff (see Materials and Methods). D, Group data of calculated Deff values for Syn-GFP in the soma and terminals.

