Figure 5.
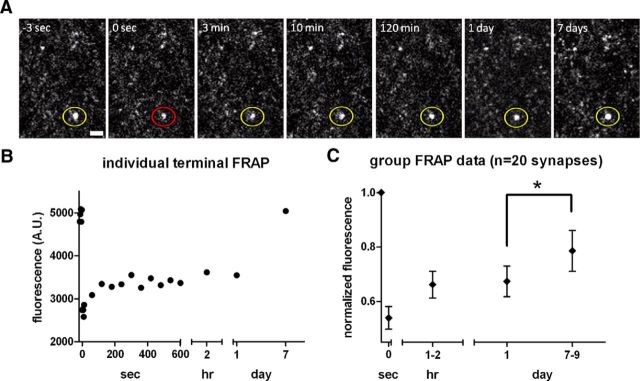
Long-term synaptic terminal in vivo multiphoton FRAP imaging. A, Set of cortical terminals expressing Syn-GFP is shown with circle demonstrating individual terminal before (yellow), immediately after (red) bleach pulse, and during recovery phase (yellow). Scale bar, 2 μm. B, Individual terminal FRAP recovery curve measured over seconds, hours, and days time scales. C, Group terminal FRAP data over multiple time scales demonstrates significant recovery of a portion of the immobile fraction between 1 and 7–9 d postbleach. Error bars indicate SEM.

