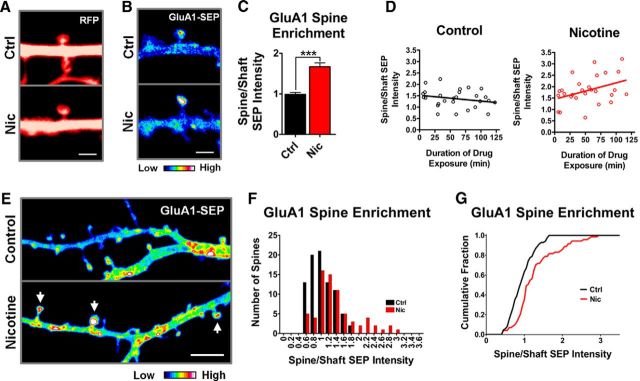
Figure 5.
The nicotine-induced decrease in GluA1-SEP mobility on spines correlates with an increase in receptor density on spines. A, Representative prebleach images from FRAP experiments in which spine area was calculated from the RFP signal. B, Representative prebleach images from FRAP experiments demonstrating nicotine-induced enrichment of GluA1-SEP at spines. C, Quantification of GluA1-SEP enrichment on spines by measuring spine/shaft optical density yielded a significant increase in cells exposed to nicotine, suggesting that nicotine leads to the accumulation of receptors on spines. (Ctrl vs Nic: 0.99 ± 0.05 vs 1.67 ± 0.1; n = 29,28; p = 0.00000014, WC). D, The nicotine effect on GluA1-SEP spine enrichment occurs gradually over 2 h. Cultures were transferred into a perfusion chamber with 1 μm nicotine and imaged for 2 h. Data points represent the spine enrichment of GluA1-SEP measured from the baseline images of corresponding FRAP experiments of different spines. Values were fit with a linear regression demonstrating a trend in nicotine-treated cultures, but not control cultures (control: slope −0.003 ± 0.002, y-intercept 1.52 ± 0.15 n = 27, r2 = 0.0554, p = 0.2373; nicotine: slope 0.007 ± 0.003, y-intercept 1.446 ± 0.21, n = 27, r2 = 0.1572, p = 0.0406). E, Representative images depicting the effect of nicotine on the population distribution of GluA1-SEP spine enrichment on dendritic arbors. Images were taken at 5× zoom to visualize multiple spines from a single dendrite (enrichment images were usually at 15×). Z-stacks were collapsed as a sum of all slices in ImageJ. Arrows indicate enriched spines. Scale bar, 5 μm. F, Frequency histogram of GluA1-SEP enrichment at spines from multiple neuronal dendritic arbors revealing a shift toward greater enrichment in nicotine-treated cells and the appearance of a heavily enriched subpopulation (Ctrl, n = 85 spines from 5 cells; Nic, n = 71 spines from 5 cells, 1 week of plating). G, Cumulative frequency plot of data from B demonstrating the statistically significant difference between the two distributions (Ctrl vs Nic, p = 0.0007, KS).

