
Figure 1.
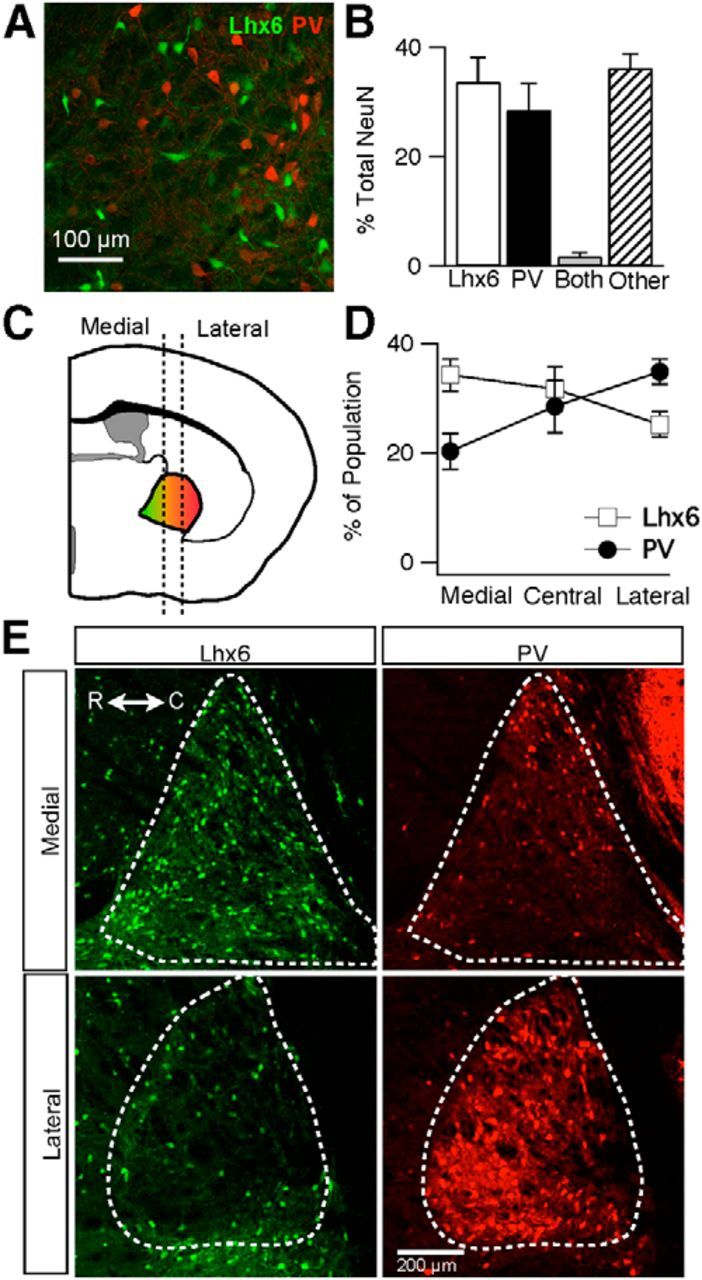
Identification and distribution of Lhx6–GPe and PV–GPe neurons in transgenic mice. A, Epifluorescent image from the GPe of an Lhx6–GFP mouse immunostained for PV showing two distinct populations of Lhx6+/PV− (green) and Lhx6−/PV+ (red) neurons. B, Graph showing the percentage of neurons that are Lhx6+/PV−, Lhx6−/PV+, both, or other throughout the GPe. Error bars are SEM. C, Schematic depiction of cell-type gradient found along the mediolateral axis. Dotted lines divide the GPe into the three zones used for analysis of the mediolateral axis. The Lhx6 population (green) is found primarily in the medial portion, whereas PV population (red) is found more laterally. D, Graph of the percentage of each cell population located within the three divisions along the mediolateral axis. Error bars are SEM. E, Epifluorescent images of medial and lateral sections of the GPe showing Lhx6–GFP (green) or PV immunofluorescence (red). R, Rostral; C, caudal. Scale bar, 200 μm.