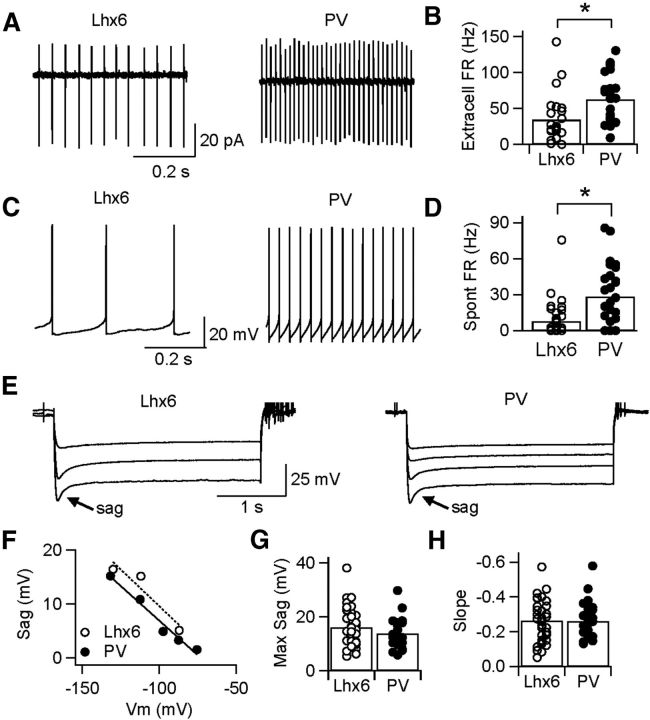
Figure 2.
Differences in baseline firing rates of Lhx6–GPe and PV–GPe neurons. A, Representative traces of cell-attached recordings from Lhx6 (left) and PV (right) neurons, showing tonic firing with low interspike variability. B, Extracellular firing rates (FR) recorded for the population of PV–GPe neurons were significantly faster than those for Lhx6–GPe neurons. *p = 0.001. C, Representative traces of spontaneous firing in whole-cell recording configuration for Lhx6 (left) and PV (right) neurons. D, Spontaneous firing rates recorded for the population of PV–GPe neurons were significantly faster than those for Lhx6–GPe neurons. *p = 0.0003. E, Responses of representative Lhx6 (left) and PV (right) neurons to 3 s hyperpolarizing steps in current clamp. F, Amplitude of sag current plotted as a function of Vm reached immediately after the hyperpolarizing step for neurons in E. G, H, Maximum amplitude of the sag current (G) and its linear relationship to Vm (H), recorded for the population of Lhx6–GPe and PV–GPe neurons.

