
Figure 4.
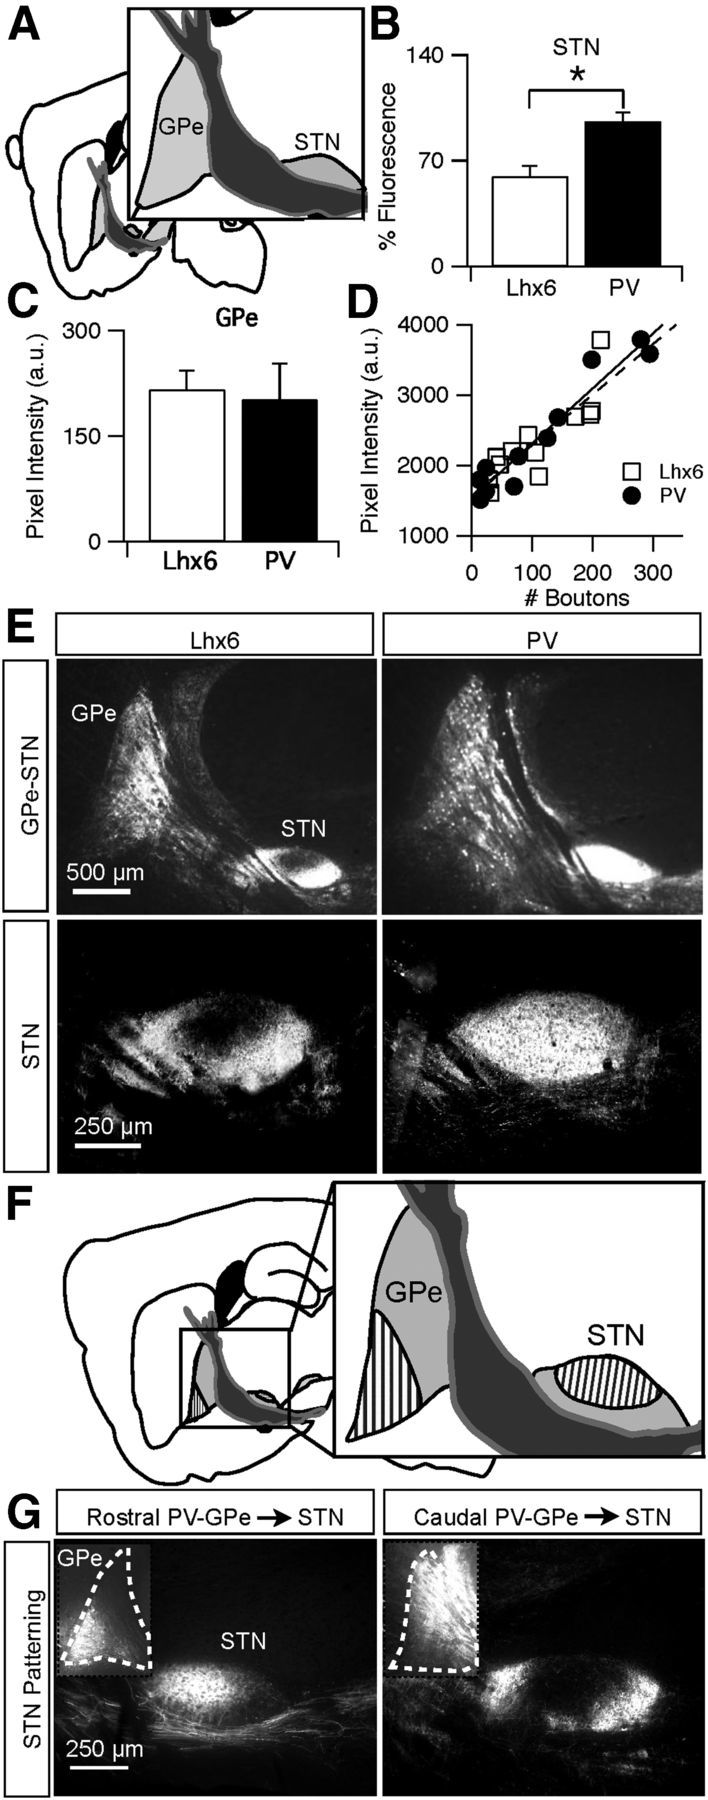
PV–GPe neurons project more strongly to the STN than Lhx6–GPe neurons. A, Schematic of central sagittal plane used for analysis. B, Normalized fluorescence intensity of axons from Lhx6–GPe and PV–GPe neurons in the STN. *p = 0.006. Error bars are SEM. C, Fluorescence intensities measured in the GPe of Lhx6–Cre and PV–Cre mice 2 weeks after viral injections. Error bars are SD. D, Scatter plot showing a similar linear relationship between pixel intensity and bouton number within a 143 μm2 area of tissue, analyzed in brain areas receiving low, medium, and high densities of axonal innervation. E, EYFP fluorescence in Lhx6–Cre (left) and PV–Cre (right) mice 2 weeks after viral injections. Top, Magnification at 2.5× epifluorescent images displaying typical expression in the GPe and STN. Bottom, Magnification at 10× epifluorescent images from the central plane of analysis displaying fluorescence in the STN. F, Schematic of the topographic organization of PV–GPe projections from the rostral (striped) and caudal (solid) GPe to the STN. G, Representative examples of viral injections in the rostral (left) or caudal (right) GPe and their resulting projections onto the STN.