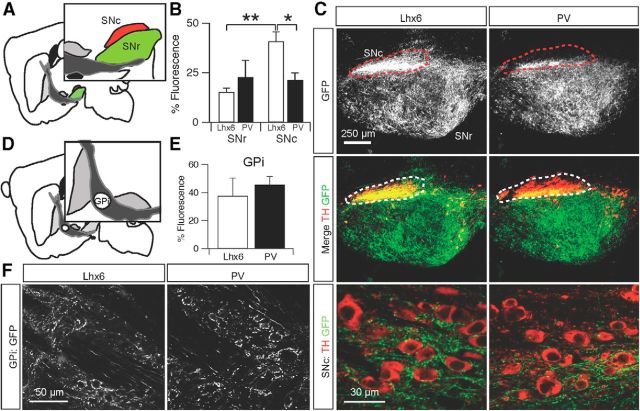
Figure 5.
Lhx6–GPe and PV–GPe projections to basal ganglia output nuclei. A, Schematic of the central sagittal plane used for analysis and reference to the distinct areas of the SN: SNc (red) and SNr (green). B, Normalized fluorescence intensity of axons from Lhx6–GPe and PV–GPe neurons in the SNr and SNc. Lhx6–GPe neurons projected more densely to the SNc than PV–GPe neurons, and Lhx6 projections to the SNc were denser than those to the SNr. *p = 0.03; **p = 0.002. Error bars are SEM. C, Top, Epifluorescent images of axons from Lhx6–GPe and PV–GPe neurons in the SNr and SNc (outlined with dotted line). Middle, Overlay of GPe axons (green) and TH immunofluorescence (red). Bottom, Confocal images of Lhx6–GPe and PV–GPe axons (green) in the SNc; TH+ dopamine neurons are red. D, Schematic of GPi location within the internal capsule. E, Normalized fluorescence intensity of axons from Lhx6–GPe and PV–GPe neurons in the GPi. Error bars are SEM. F, Confocal images of Lhx6–GPe and PV–GPe axons in the GPi. Note that the GPi neurons did not express EYFP.

