
Figure 6.
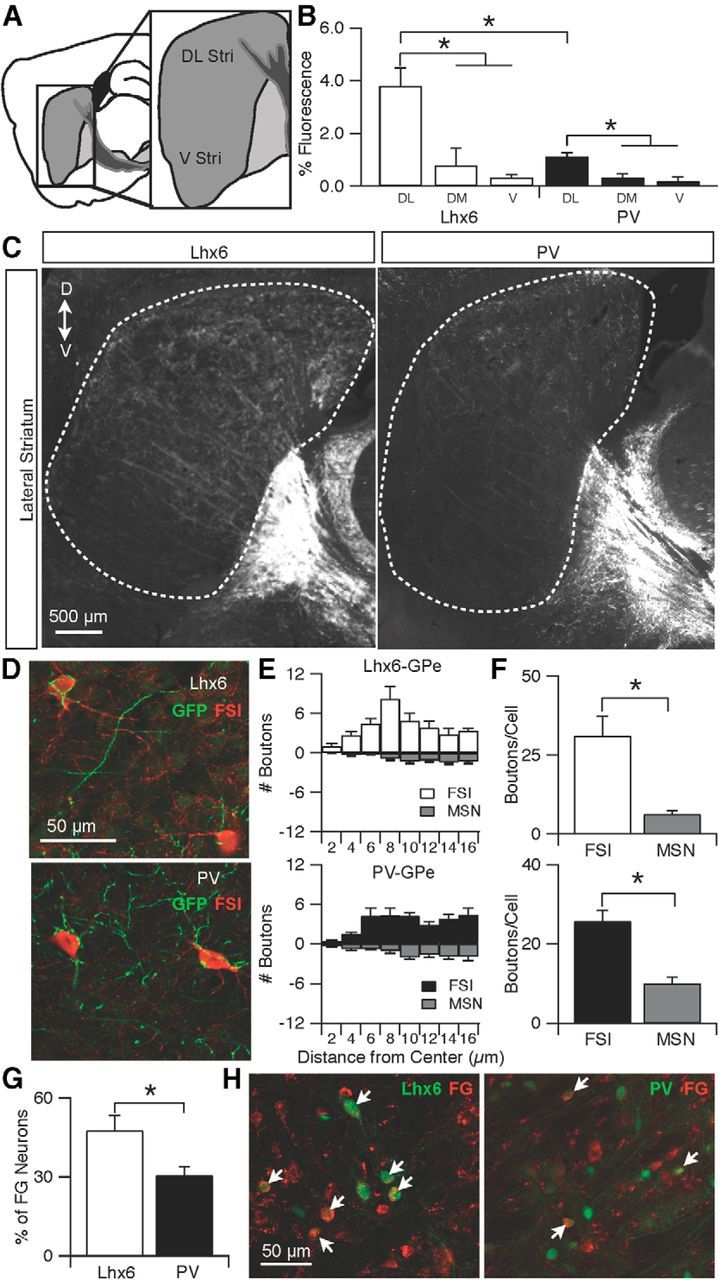
Lhx6–GPe neurons project more strongly to the dorsolateral striatum than PV–GPe neurons. A, Schematic of the sagittal plane used for analysis. DL Str, Dorsolateral striatum; V Str, ventral striatum. B, Normalized fluorescence intensity of axons from Lhx6–GPe and PV–GPe neurons to the dorsolateral striatum (DL), dorsomedial striatum (DM), and ventral striatum (V). Striatal projections from both cell types were significantly denser to the dorsolateral region than to the dorsomedial or ventral regions (Lhx6: DL vs DM, p = 0.020; DL vs V, p = 0.003; PV: DL vs DM, p = 0.006; DL vs V, p = 0.004); dorsolateral projections from Lhx6–GPe neurons were significantly denser than dorsolateral projections from PV–GPe neurons. Error bars are SEM. C, Epifluorescent images of axons from Lhx6–GPe and PV–GPe neurons in the striatum. D, Dorsal; V, ventral. D, Confocal images showing the selective innervation of Lhx6–GPe axons (top, green) or PV–GPe axons (bottom, green) onto striatal FSIs (red). E, Results of Sholl analysis. Number of boutons from Lhx6–GPe (top) or PV–GPe (bottom) neurons were counted in concentric circles of increasing diameter (2 μm) around striatal FSIs or MSNs. F, Bar graphs comparing total number of boutons onto FSIs or MSNs from Lhx6–GPe (top, *p = 0.001) or PV–GPe (bottom, *p = 0.0001) neurons. G, Bar graph showing the percentage of FG-labeled neurons that were either Lhx6+ or PV+. Significantly more FG neurons were Lhx6+ than were PV+ (*p = 0.003). H, Confocal images of the GPe in tissue from an Lhx6–GFP mouse, stained for PV and antibodies against FG. The Lhx6–GPe (left) and PV–GPe (right) neurons (green) showed colocalization with the retrograde tracer FG (red). Arrows indicate double-labeled neurons.