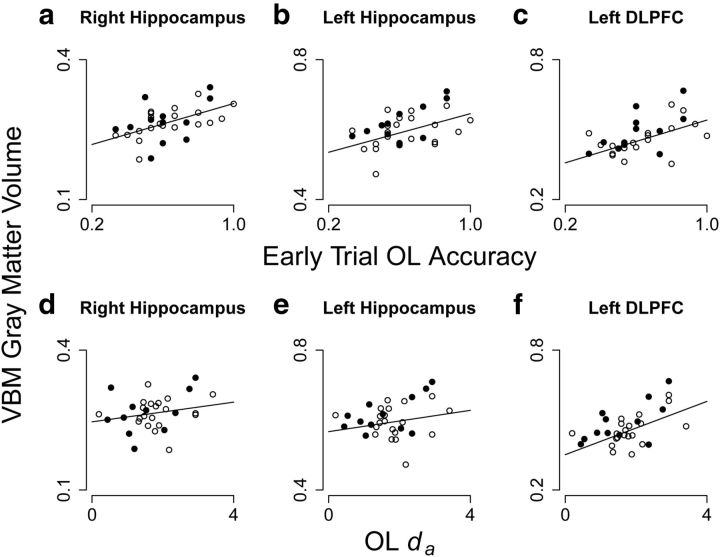
Figure 5.
Scatter plots further characterizing the specificity of our structure-performance relationships in peak voxels in the hippocampus and DLPFC identified in our SPM analyses. Top row plots (a–c) indicate the distribution of individual gray matter volume estimates around the accuracy regression line. Bottom row plots (d–f) indicate the distribution of individual gray matter volume estimates around the learning rate (da) regression line. Solid dots indicate male participants, and open circles indicate female participants. Right and left peak hippocampal voxels show a markedly stronger relationship with OL accuracy (a and b) than OL learning rate (d and e). The peak left DLPFC voxel that correlated with OL learning rate (f) also showed a moderate relationship with accuracy (c), although the distribution of individual participants around these lines differs and the relationship with accuracy is nonsignificant.

