
Figure 2.
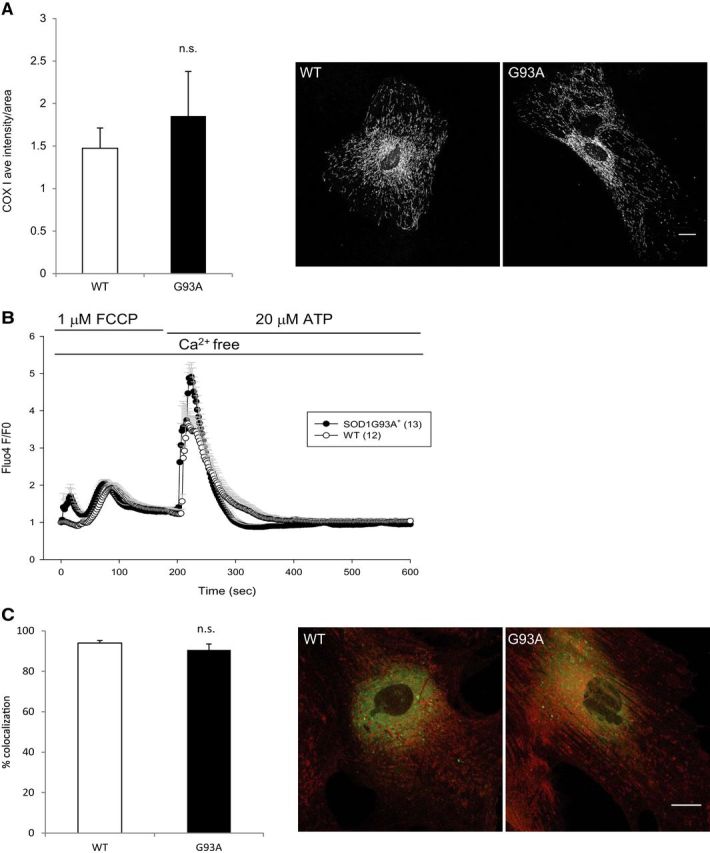
Lack of mitochondrial involvement in the abnormal intracellular calcium signaling in SOD1G93A+ astrocytes. A, Average intensity of COXI immunostaining in SOD1G93A+ and WT astrocytes. The right images are representative COXI immunostaining in SOD1G93A+ and WT astrocytes. B, Average traces of Fluo4 fluorescence changes in SOD1G93A+ and WT astrocytes stimulated with 1 μm FCCP and then 20 μm ATP in calcium-free imaging medium. Despite blockage of mitochondrial calcium buffering, ATP stimulation leads to larger ER calcium release in SOD1G93A+ astrocytes. C, The extent of ER–mitochondrial contact sites were assessed by quantification of colocalization of Mitotracker and ERtracker in SOD1G93A+ and WT astrocytes. Images are representative labeling of ER (green), mitochondria (red), and colocalization of the two organelles (yellow). Scale bars, 20 μm. All error bars indicate SEM, and n.s. indicates a lack of statistical significance, as determined by the Student's t test.