
Figure 8.
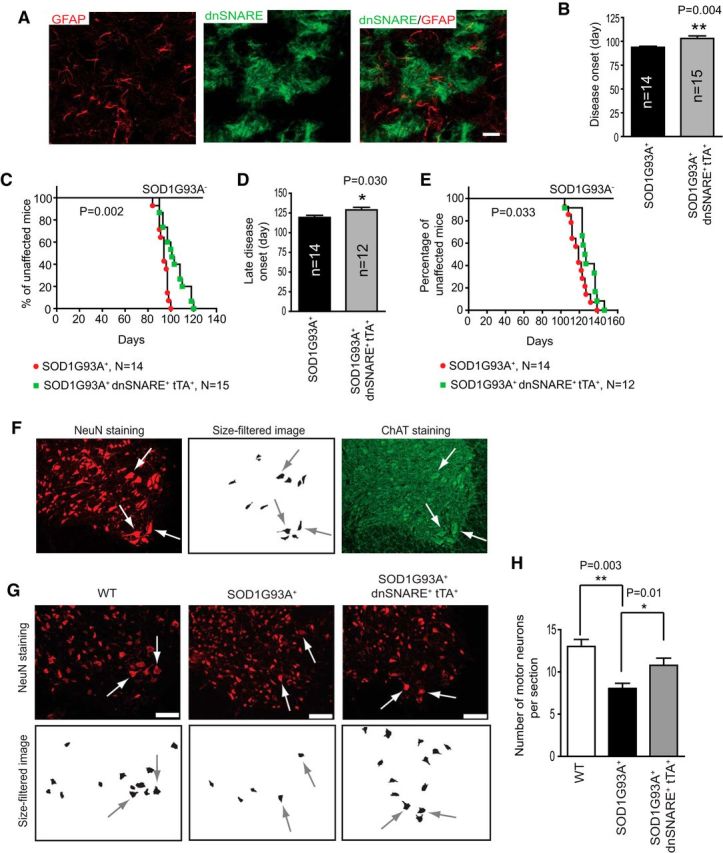
Inhibition of astrocyte exocytosis significantly delays early and late disease onset in SOD1G93A mice. A, Representative images of eGFP/dnSNARE expression in SOD1G93A+ dnSNARE+ tTA+ mouse spinal cord. Scale bar, 25 μm. B–E, Early disease onset, determined by the loss of 10% forelimb grip strength (B, C) and late disease onset, determined by the 10% overall weight loss (D, E) in SOD1G93A+ and SOD1G93A+ dnSNARE+ tTA+ mice. The log-Rank statistical analysis was used to determine the significance of disease early and late onset Kaplan–Meier curves. F, Representative images of NeuN+ staining, overlaid size-filtered NeuN+, and ChAT+ staining of motor neurons in mouse spinal cord ventral horn. G, Illustration of motor neurons by NeuN staining in spinal cord ventral horn of different genotypes. Scale bar, 100 μm. H, Quantitative analysis of motor neuron numbers in ventral spinal cord in WT, SOD1G93A+, and SOD1G93A+ dnSNARE+ tTA+ mice at P90–P100. n = 180–240 cells from 3–4 mice per group. *p < 0.05, **p < 0.01 by Student's t test.