
Figure 9.
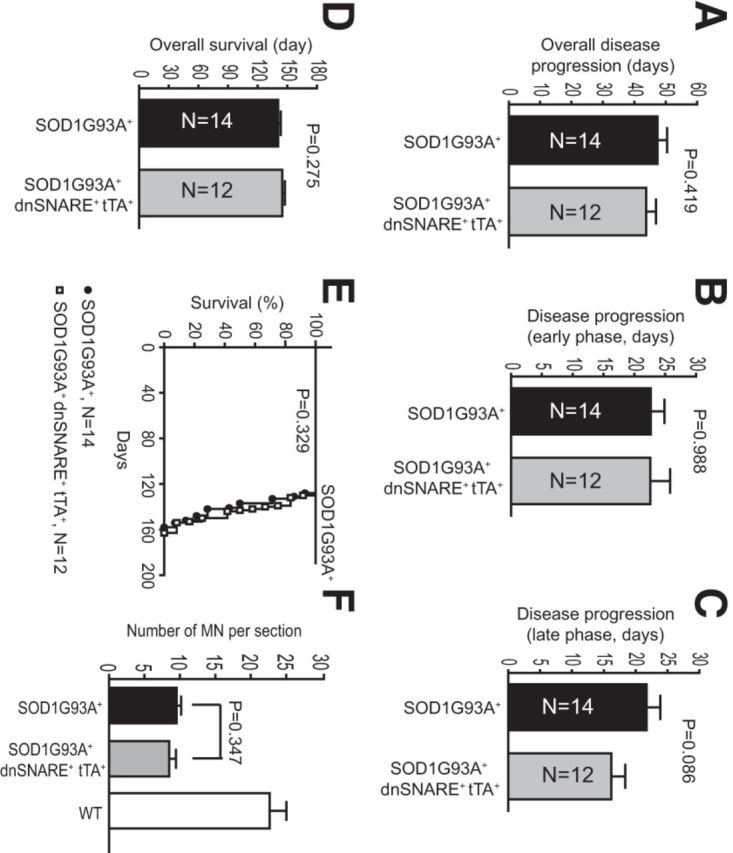
Disease progression is not altered in SOD1G93A+ dnSNARE+ tTA+ mice. A–C, Similar overall (A), early (B), and late (C) disease progression was found in SOD1G93A+ and SOD1G93A+ dnSNARE+ tTA+ mice. D, E, Overall survival time of SOD1G93A+ and SOD1G93A+ dnSNARE+ tTA+ mice. The log-rank statistical analysis was used to determine the significance of overall survival Kaplan–Meier curves. F, Quantitative analysis of motor neuron numbers in ventral spinal cord in WT, SOD1G93A+, and SOD1G93A+ dnSNARE+ tTA+ mice. n = 90–150 cells from 3 mice per group. p = 0.347 by Student's t test.